Why Every Refrigeration Professional Needs the 404A P-T Chart
The 404a p-t chart is the most essential tool for diagnosing and servicing commercial refrigeration systems using R404A refrigerant. Here's what you need to know:
Key 404A P-T Chart Data:
- At 70°F: R404A pressure = 118.9 psi
- Normal suction pressure: 15-25 psi (can run 68-70 psi in some systems)
- Normal discharge pressure: 150-270 psi
- At 0°F: Liquid = 46.1 psig, Vapor = 43.3 psig
- At 100°F: Liquid = 236.8 psig, Vapor = 234.6 psig
R404A refrigerant powers commercial cold storage - from supermarket display cases to refrigerated trucks. This synthetic blend maintains consistent temperatures in walk-in coolers, freezers, and transport units where product integrity matters most.
The pressure-temperature relationship is straightforward: as temperature rises, so does pressure. But reading the chart correctly means the difference between a quick fix and costly equipment failure. Understanding both liquid and vapor pressure columns helps you calculate superheat, diagnose leaks, and verify proper system operation.
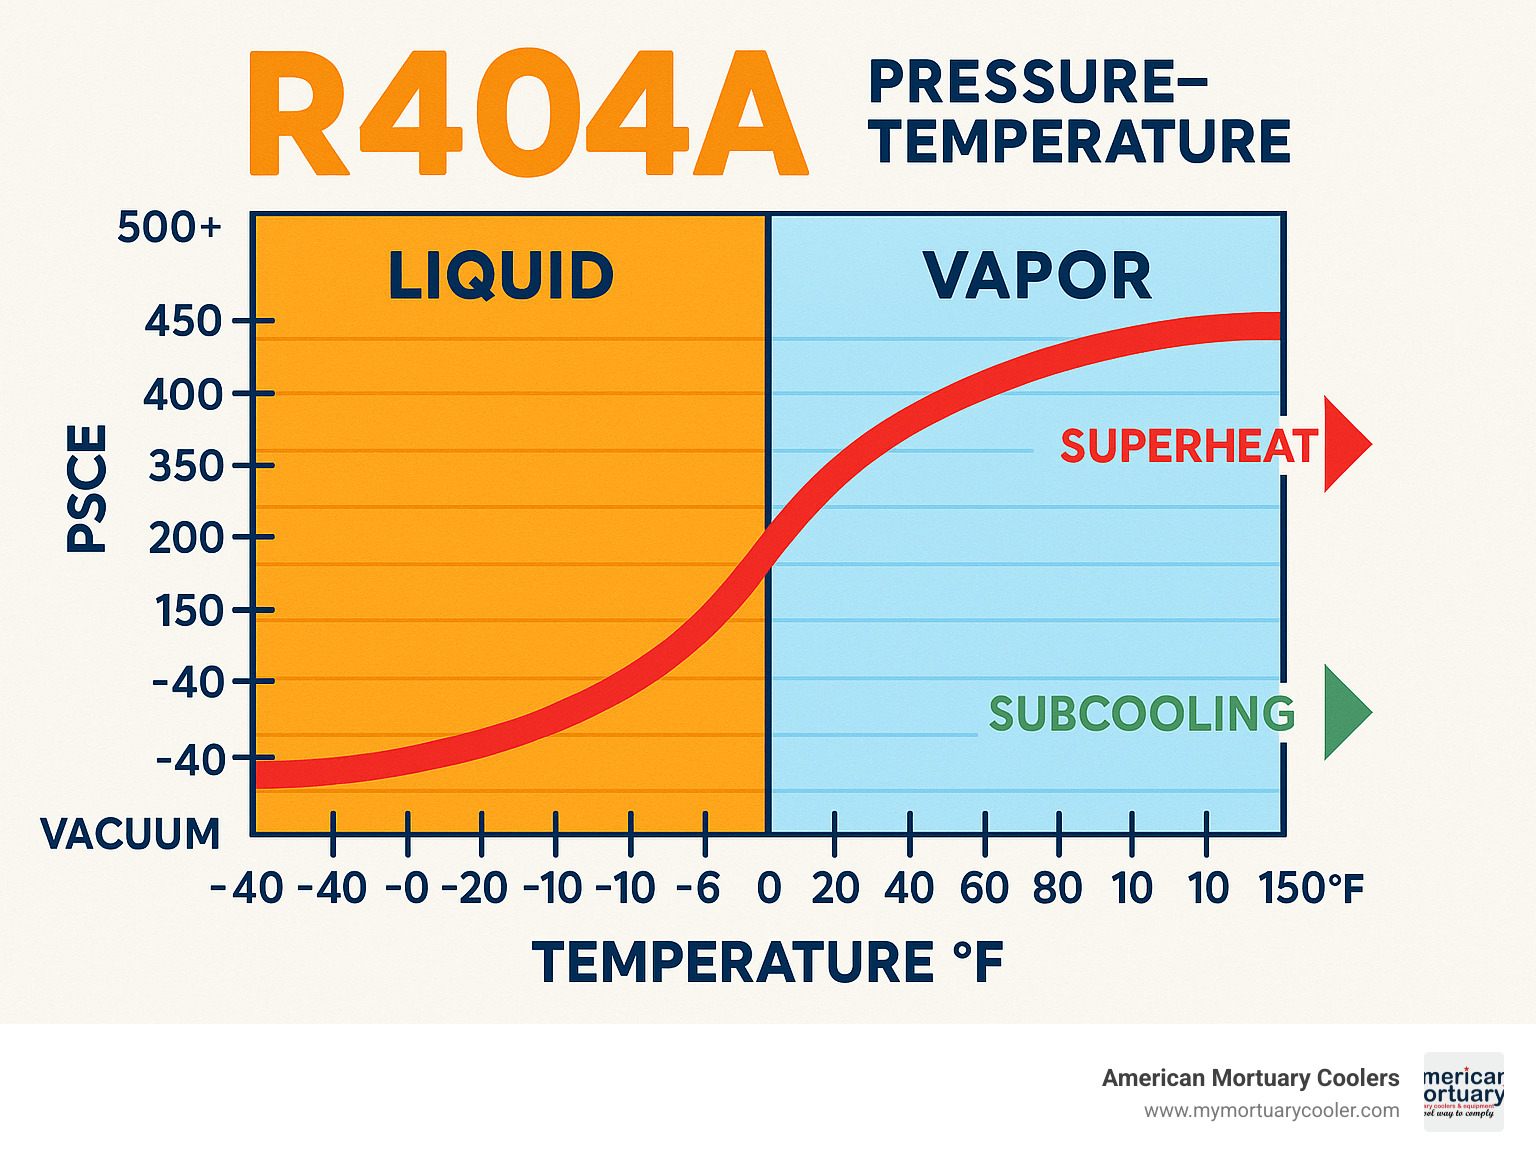
404a p-t chart terms to learn:
Why Every HVAC/R Pro Needs This Guide
Whether you're troubleshooting a walk-in freezer at 2 AM or commissioning a new cold storage facility, the 404a p-t chart gives you instant answers. This guide builds your diagnostic skills systematically, helping you spot system problems faster and increase customer confidence.
Understanding R404A Refrigerant Basics
R404A is the workhorse of commercial refrigeration. This synthetic blend combines three refrigerants - 44% R-125, 52% R-143a, and 4% R-134a - but acts almost like a single refrigerant. That makes your job easier when reading the 404a p-t chart.
R404A became the hero refrigerant in the 1990s when everyone needed to replace R-502. The minimal temperature glide (less than 1°F) means you don't have to worry about the blend separating during operation. However, R404A has a Global Warming Potential (GWP) of nearly 4,000, which is why regulations are pushing toward lower-GWP alternatives.
What Is R404A and Where Is It Used?
R404A shines in both low-temperature and medium-temperature applications. Medium-temperature systems typically run evaporator temperatures between 20°F and 40°F for walk-in coolers and fresh food displays. Low-temperature applications go down to -40°F for ice cream freezers and blast freezers.
You'll find R404A in supermarket refrigeration systems, cold storage warehouses, transport refrigeration, food processing facilities, and commercial kitchens. Each application creates different operating conditions that show up differently on your 404a p-t chart.
Key Thermodynamic Properties You Must Know
R404A boils at -51.8°F at atmospheric pressure - that's why it can absorb heat so effectively. The critical temperature of 162.5°F represents the absolute upper limit where R404A can exist as a liquid. The critical pressure of 548.2 psia works with critical temperature to define the operating envelope.
Minimal temperature glide makes R404A user-friendly. The blend components stay together during evaporation and condensation, making charging and service straightforward.
Typical Operating Pressures & Temperatures
Walk-in cooler systems maintaining 35-38°F typically show suction pressures around 68-70 psi with discharge pressures between 250-270 psi when ambient temperatures hit 95°F.
Walk-in freezer systems running evaporator temperatures from -10°F to 0°F show suction pressures of 15-25 psi while discharge pressures remain similar at 250-270 psi.
These baseline expectations help you quickly spot problems when actual readings don't match what your 404a p-t chart predicts.
Decoding the 404A P-T Chart
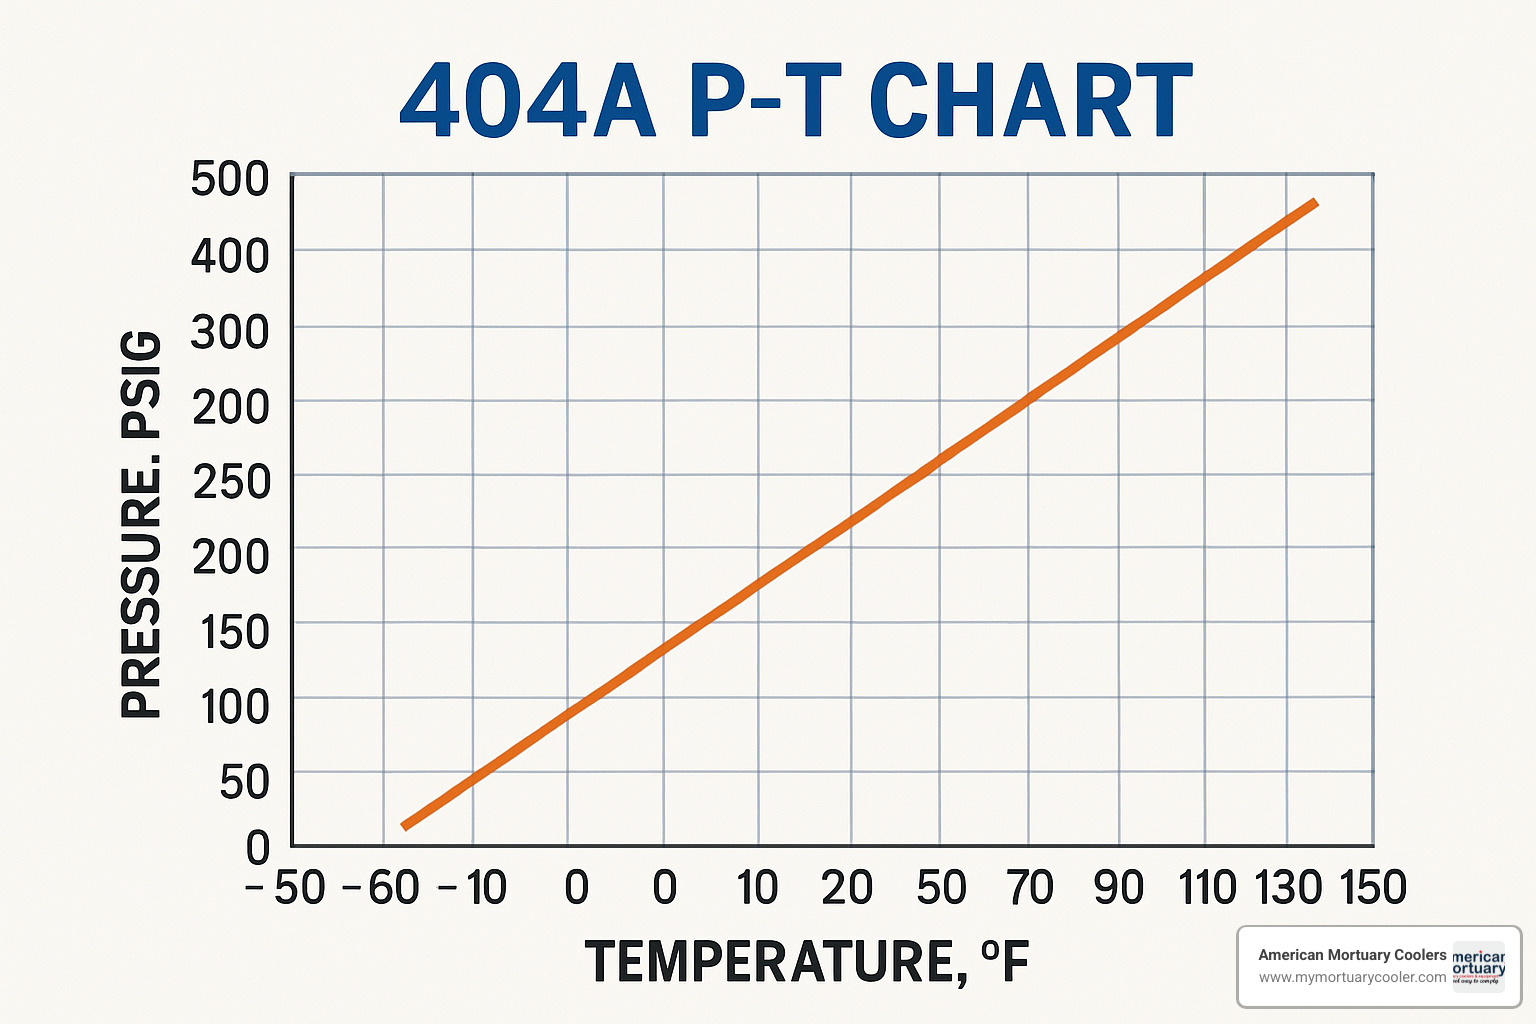
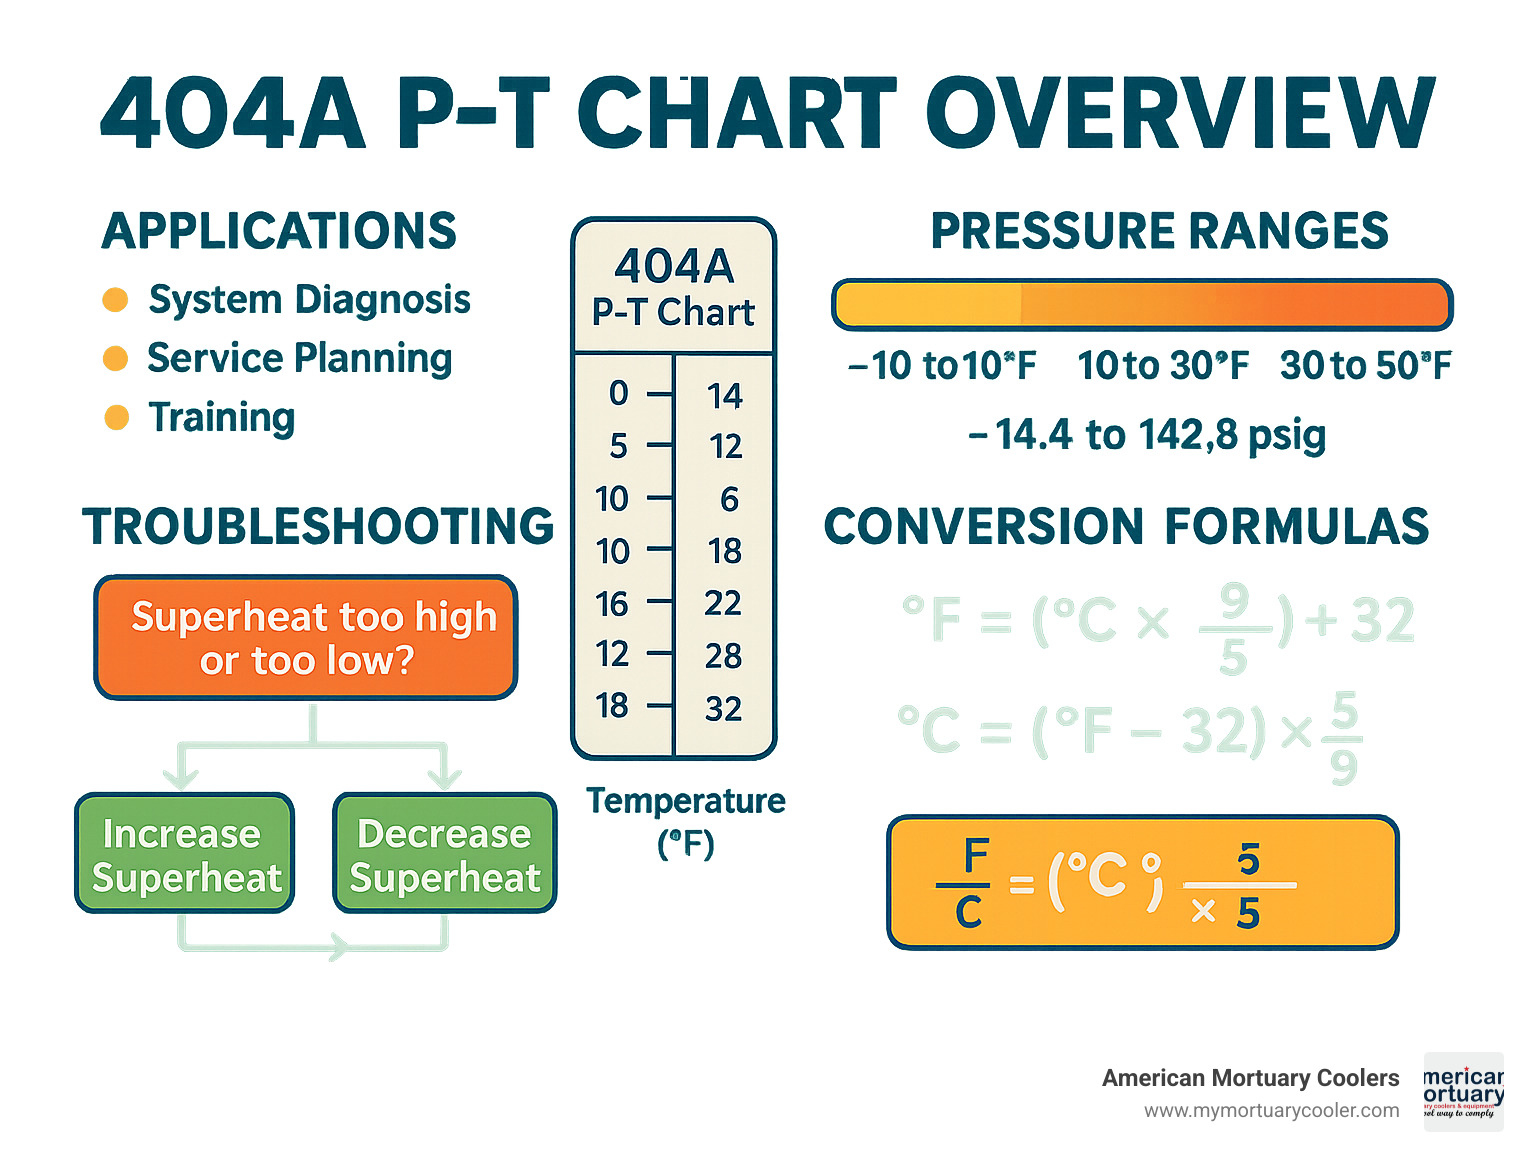
The 404a p-t chart becomes your best friend once you understand what you're looking at. It translates between pressure and temperature - two measurements that tell the complete story of what's happening inside any R404A system.
The chart has two main columns. The saturated liquid column shows the bubble point - where R404A starts to boil at any temperature. The saturated vapor column shows the dew point - where vapor begins turning back into liquid.
R404A's advantage: those columns are practically identical. At 0°F, liquid pressure reads 46.1 psig while vapor pressure shows 43.3 psig. That tiny 2.8 psi difference makes your job easier.
Anatomy of a 404A P-T Chart: Columns, Units, Color Codes
Pressure gets measured three main ways. In North America, we use psig (pounds per square inch gauge). European equipment shows barg where 1 bar equals about 14.5 psi. International charts show kPa - multiply psi by 7 for rough conversion.
Temperature units are °F for US work and °C for international applications. Most charts show both.
Special markings help spot unusual conditions. Pressures below atmospheric appear in red italics showing inches of mercury below zero.
How to Read a 404A P-T Chart in Seconds
When you know pressure and need temperature, find your gauge reading in the pressure column, then slide across to read saturation temperature. When you know temperature and need pressure, start with temperature and move across to find corresponding pressure.
Interpolation is educated guessing between lines. If you measure 55 psi, but your chart shows 50 psi at 32°F and 60 psi at 40°F, split the difference - 55 psi gives about 36°F.
Calculating Superheat & Subcooling with the 404A P-T Chart
Superheat calculation tells you how much heat the refrigerant picked up beyond its boiling point. Measure suction line temperature and pressure, use the vapor column to find what temperature that pressure should create. Subtract chart temperature from measured temperature for superheat.
Example: Suction line reads 25°F at 20 psi. Chart shows 20 psi vapor corresponds to 15°F saturation. Superheat is 25°F minus 15°F = 10°F superheat.
Subcooling calculation works in reverse. Measure liquid line temperature and pressure, find saturation temperature from liquid column, then subtract measured temperature from chart temperature.
For detailed system repair techniques, our walk-in cooler repair guide walks through proper procedures.
Diagnosing System Issues Using a 404A P-T Chart
Low suction pressure with normal superheat usually points to refrigerant shortage, liquid line restrictions, or expansion valve problems.
High discharge pressure with normal subcooling typically means dirty condenser coils, non-condensable gases, refrigerant overcharge, or blocked airflow.
Abnormal superheat and subcooling patterns help identify specific components. High superheat plus low suction pressure suggests undercharge. Low superheat with normal pressures indicates overcharge or expansion valve issues.
Practical Field Use of the 404a P-T Chart
The 404a p-t chart comes in several field-ready formats. Digital manifolds integrate P-T charts directly into gauge sets, automatically calculating superheat and subcooling. Smartphone apps put interactive charts in your pocket with bonus features. Laminated pocket cards work in sub-zero temperatures, don't need charging, and resist moisture.
404a P-T Chart Best Practices for Walk-In Coolers
Produce coolers need gentle cooling to prevent moisture loss. These systems run evaporator temperatures between 28°F and 32°F, creating suction pressures around 65-75 psi. Target superheat stays at 6-8°F with subcooling at 8-12°F.
Meat display cases require more aggressive cooling. Evaporator temperature drops to 25-28°F, pushing suction pressures to 55-65 psi. Superheat increases to 8-10°F while subcooling bumps up to 10-15°F.
Line sizing affects system performance. Undersized suction lines create pressure drops that throw off your 404a p-t chart readings, while oversized lines allow oil to settle.
404a P-T Chart Best Practices for Freezers & Transport Units
Walk-in freezers operating at -10°F to 0°F create suction pressures of 10-25 psi with 8-12°F superheat. Subcooling remains important at 10-15°F.
Transport refrigeration faces constantly changing conditions. Frozen cargo requires evaporator temperatures similar to walk-in freezers, while fresh produce needs gentler cooling around 32-38°F.
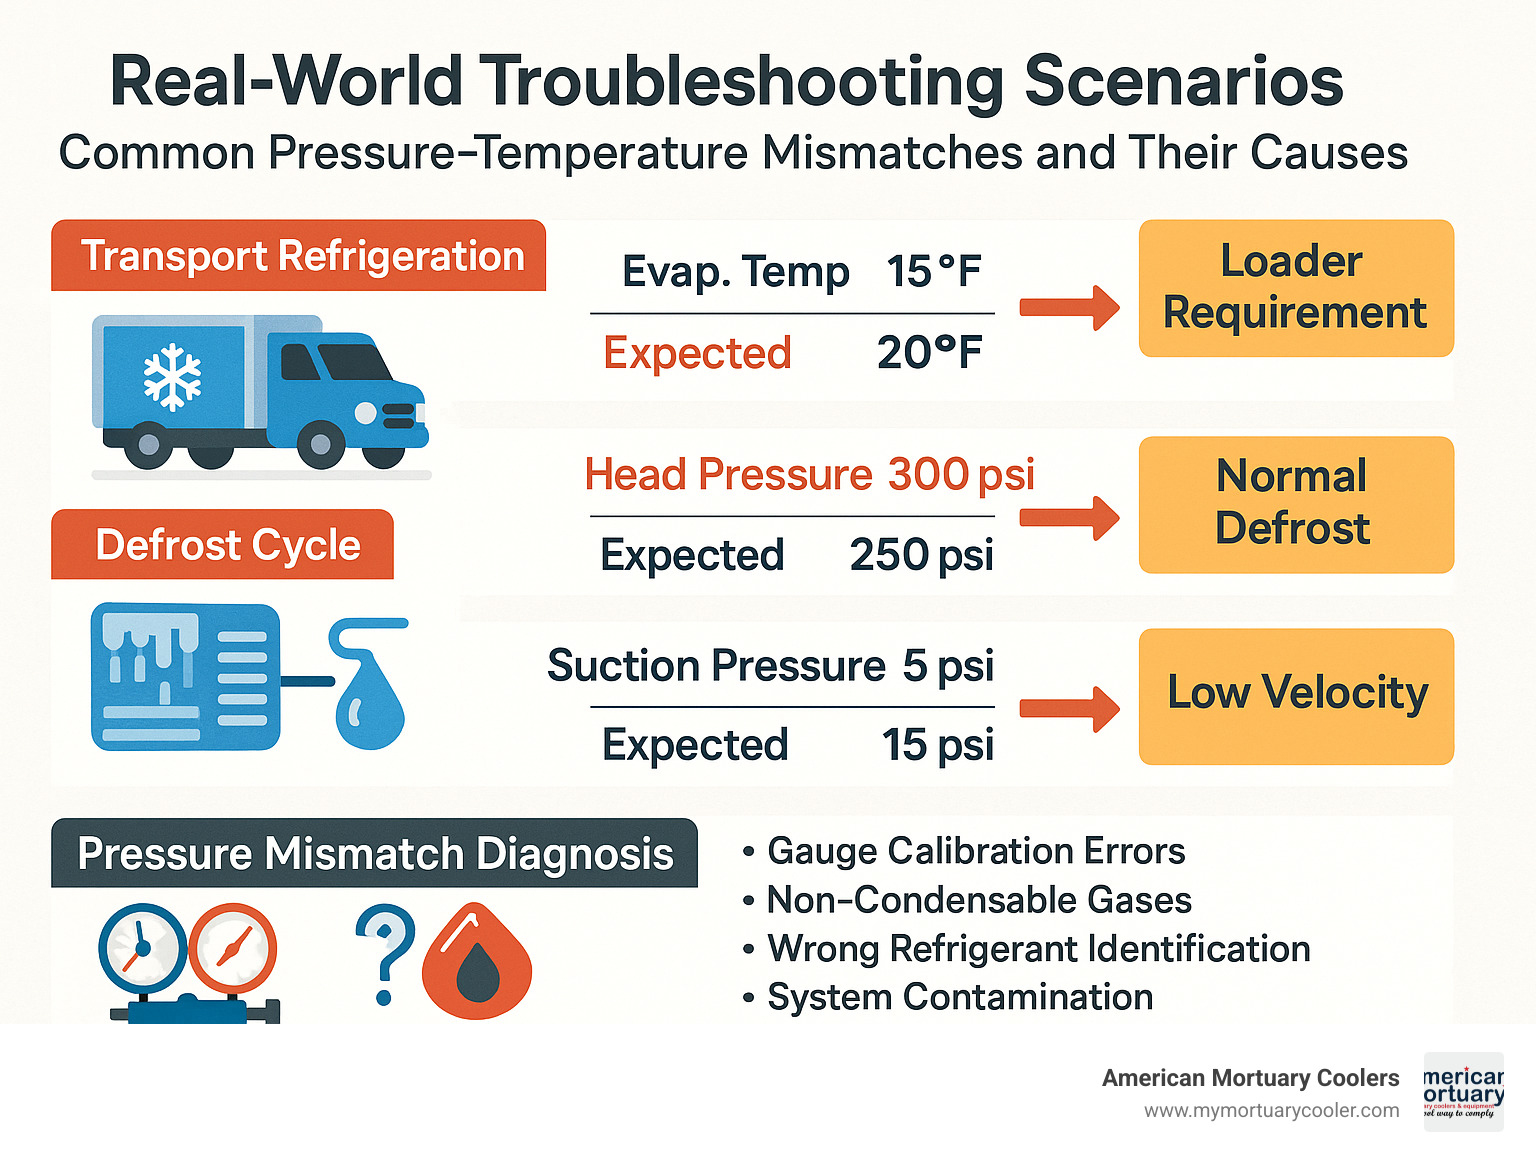
Defrost cycles temporarily spike pressures above normal ranges. Your 404a p-t chart helps distinguish between normal defrost pressure rises and actual problems.
Real-World Troubleshooting Walk-Throughs
A supermarket meat case runs warm. Gauge readings show suction at 45 psi and 35°F, with discharge at 280 psi and 110°F.
Consulting your 404a p-t chart, 45 psi vapor pressure corresponds to 22°F saturation temperature. Superheat calculation: 35°F - 22°F = 13°F superheat, slightly above normal 8-12°F range.
This points to minor undercharge or restriction. Adding refrigerant in small increments while monitoring superheat brings the system back to normal.
Environmental Regulations & Alternative Refrigerants
R404A faces serious regulatory pressure. With its Global Warming Potential of nearly 4,000, the EPA SNAP program and F-Gas regulations are pushing toward greener alternatives. New equipment installations using R404A are prohibited in many applications, while existing systems can still be serviced but face increasing restrictions.
Comparing 404A with Lower-GWP Options
Several proven alternatives offer similar performance with lower environmental impact.
R-448A (Solstice N40) leads with GWP of 1,387 - a 65% reduction from R404A. Capacity match is nearly identical, works with existing POE lubricants, but requires two-column P-T charts due to higher temperature glide.
R-452A (XP44) offers GWP of 2,141 - still a 45% improvement. Transport companies prefer this option because it matches R404A efficiency while working with the same POE oil.
R-454B boasts GWP of just 466 - an 88% reduction. This blend delivers serious environmental benefits but requires higher operating pressures and has A2L safety classification requiring additional precautions.
For comprehensive pressure-temperature data on alternatives, the PT Chart Selection tool provides reliable charts for multiple refrigerants.
Charging & Service Tips When Switching Refrigerants
Converting from R404A requires attention to detail. The retrofit checklist starts with verifying oil compatibility - most R404A replacements work with existing POE lubricants. Check system materials compatibility and update service documentation.
Glide management becomes important with higher-glide alternatives. Charge as liquid to maintain proper blend ratios, use bubble point for subcooling and dew point for superheat, and watch for fractionation during leak repairs.
Resources, Apps & Unit Conversions
Today's technicians access 404a p-t chart information through multiple channels. Digital calculators eliminate manual calculations and reduce errors. Mobile apps put comprehensive data in your pocket. Printable charts remain the gold standard for reliability - they never need charging and work in extreme temperatures.
Where to Download Reliable 404A P-T Charts
Arkema provides comprehensive PDF charts with multiple unit formats and detailed properties. Honeywell offers interactive online tools with downloadable references. Equipment manufacturers publish system-specific data for particular equipment types. Industry organizations like ASHRAE and RSES maintain standardized formats.
For comprehensive refrigeration information, Unity Cooling Systems provides detailed refrigerant charts and technical support materials.
Quick Pressure-Temperature Conversion Hacks
Pressure conversions: Converting psi to bar requires dividing by 14.5, while psi to kPa means multiplying by 6.895. For estimates, 100 psi equals approximately 7 bar.
Temperature conversions: Water freezes at 32°F (0°C) and boils at 212°F (100°C). For estimates, 100°F roughly equals 38°C.
Absolute versus gauge pressure: Gauge pressure (psig) represents manifold readings, while absolute pressure (psia) adds atmospheric pressure (14.7 psi at sea level).
Frequently Asked Questions about 404A P-T Charts
Let's tackle the most common questions technicians ask about using the 404a p-t chart in real-world situations. These answers come from years of field experience and countless service calls.
What are the normal suction and discharge pressures for R404A?
The "normal" pressure question comes up constantly, and here's the straightforward answer: it depends on what you're cooling and how hot it is outside.
For medium-temperature systems like walk-in coolers storing produce or beverages, you'll typically see suction pressures around 68-70 psi when the evaporator runs at 35-38°F. The discharge pressure usually sits between 250-270 psi on a typical 95°F summer day.
Low-temperature systems tell a different story. Walk-in freezers maintaining -10 to 0°F will show much lower suction pressures - typically 15-25 psi. The discharge pressure stays similar at 250-270 psi because it's still fighting the same hot ambient air.
Here's what many techs forget: these numbers shift with conditions. A busy restaurant kitchen pushes ambient temperatures higher, raising discharge pressures. A cold winter day drops both suction and discharge readings. Always use your 404a p-t chart to verify what's normal for the actual conditions you're facing.
How do I use a 404A P-T chart to calculate superheat?
Superheat calculation becomes second nature once you understand the process. Start with two measurements: suction line temperature and suction pressure. Make sure your temperature probe sits at the 4 o'clock position on clean copper tubing, properly insulated from ambient air.
Take your measured suction pressure and find the corresponding saturation temperature in the vapor column of your 404a p-t chart. This saturation temperature represents where the refrigerant changes from liquid to vapor at that pressure.
Subtract the saturation temperature from your measured temperature - that's your superheat. Simple math, but the accuracy depends on proper measurement technique.
Here's a real example from last week's service call: The suction line read 30°F at 25 psi. Looking at the 404a p-t chart, 25 psi in the vapor column corresponds to 18°F saturation temperature. So superheat equals 30°F minus 18°F, which gives us 12°F of superheat - perfectly normal for most systems.
The key is using the vapor column, not the liquid column. Many new techs mix this up and get confused results.
Does temperature glide affect the accuracy of a 404A P-T chart?
This question shows you're thinking like a pro. Temperature glide does affect accuracy, but R404A makes your life easy with minimal glide of less than 1°F.
Most field measurements can't detect such small differences, so standard single-column 404a p-t charts work fine for everyday service. The pressure difference between liquid and vapor columns rarely exceeds 3 psi across the operating range.
However, when precision matters, use the correct column. The liquid column gives you bubble point temperatures for subcooling calculations, while the vapor column provides dew point temperatures for superheat work.
Compare this to high-glide blends like R-448A, where you absolutely must use the right column or your calculations will be way off. R404A's minimal glide means you can focus on proper measurement technique rather than worrying about which column to use.
Bottom line: For R404A, either column works for most field applications, but developing good habits with column selection prepares you for working with other refrigerants that aren't so forgiving.
Conclusion
Mastering the 404a p-t chart transforms you from someone who changes parts to someone who truly understands refrigeration systems. Whether you're reading 68 psi on a walk-in cooler's suction line or diagnosing why a freezer won't hold temperature, that 404a p-t chart gives you instant answers.
The refrigeration industry is changing fast. R404A won't be around forever - environmental regulations are pushing toward lower-GWP alternatives. But every refrigerant has its own pressure-temperature relationship, and the skills you develop reading one chart transfer directly to the next.
At American Mortuary Coolers, we've seen how proper system diagnosis prevents costly failures. When maintaining critical temperature control for sensitive applications, there's no room for guesswork. The 404a p-t chart helps ensure systems run efficiently and reliably.
Your customers notice the difference when systems run right. Lower energy bills, fewer service calls, and consistent temperatures - that's what separates professionals who understand pressure-temperature relationships from those who don't.
The investment you make in understanding these fundamentals pays dividends throughout your career. As new refrigerants emerge and technology evolves, the core principles remain the same.
For more comprehensive information about refrigeration systems, explore our detailed guide on refrigeration units and how they work.
