Why R404A PT Charts Are Essential for Refrigeration Systems
An r404 pt chart shows the exact pressure-temperature relationship for R404A refrigerant at saturation conditions. Here's what you need to know:
Key R404A Pressure Values:
- -20°F: 4.3 psig
- 0°F: 32.6 psig
- 40°F: 85.4 psig
- 100°F: 234.6 psig
Essential Facts:
- R404A is a blend of 44% R125, 4% R134a, and 52% R143a
- Global Warming Potential (GWP) of 3,922
- Critical temperature: 161.7°F
- Safety classification: A1 (non-toxic, non-flammable)
Every HVAC technician working with commercial refrigeration needs to understand pressure-temperature relationships. Whether you're charging a walk-in freezer, diagnosing a supermarket display case, or maintaining a mortuary cooler, the R404A PT chart is your roadmap to proper system operation.
The chart serves three critical functions: determining correct operating pressures, calculating superheat and subcooling values, and identifying refrigerant leaks or charging issues. Without accurate PT data, you're essentially working blind.
As seasoned technicians know, "One of the very first steps when it comes to diagnosing your home air conditioner, refrigerator, or even your vehicle's air conditioner is understanding the temperature and the current pressure that your system is operating at."
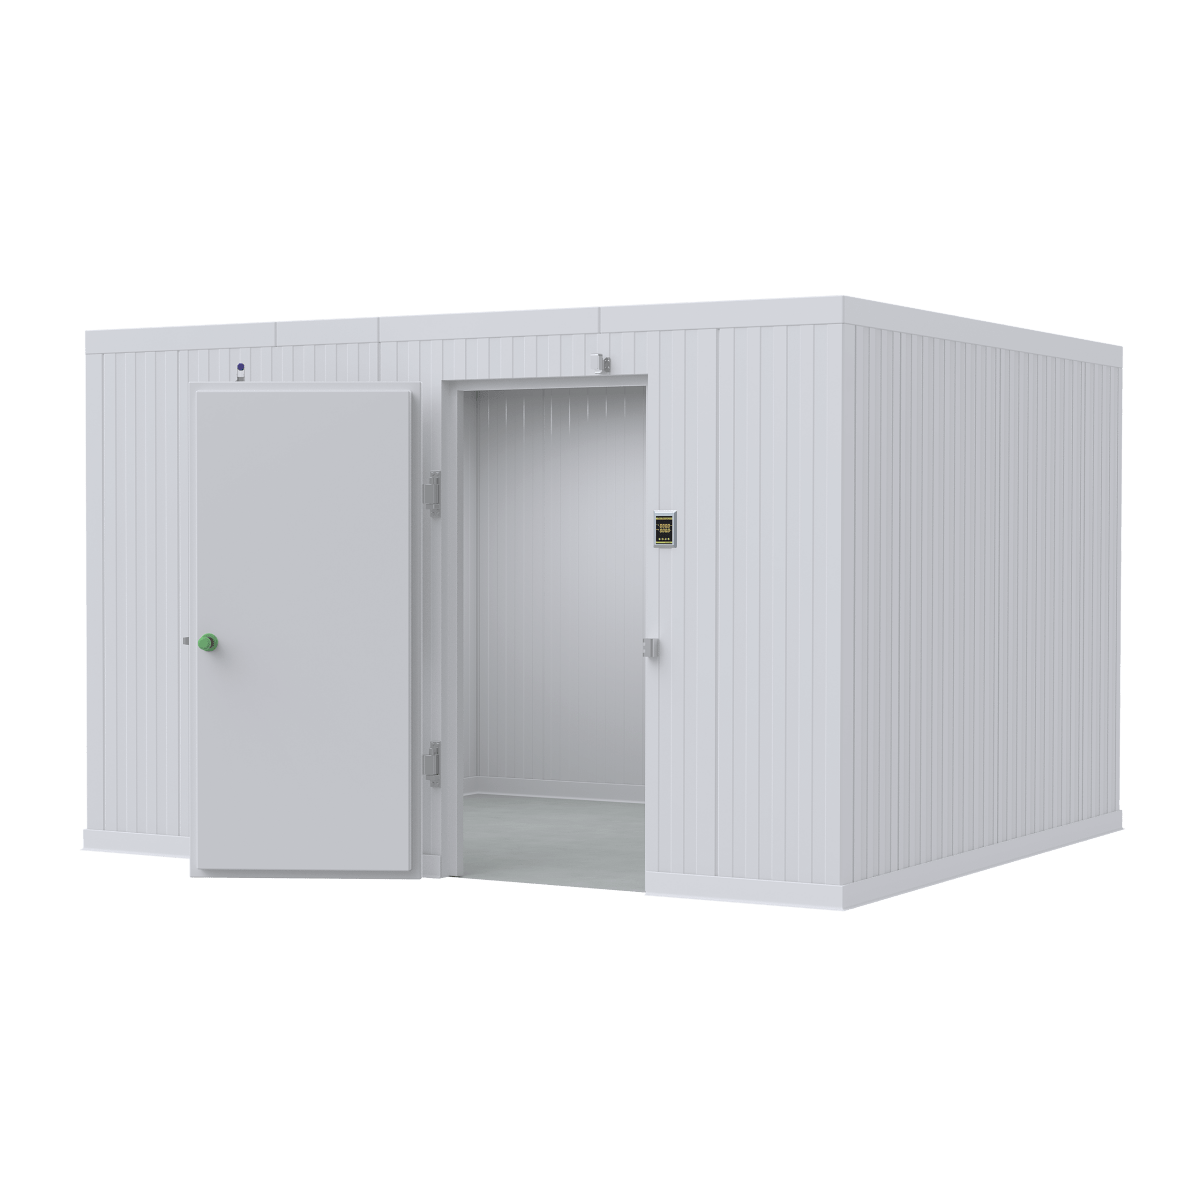
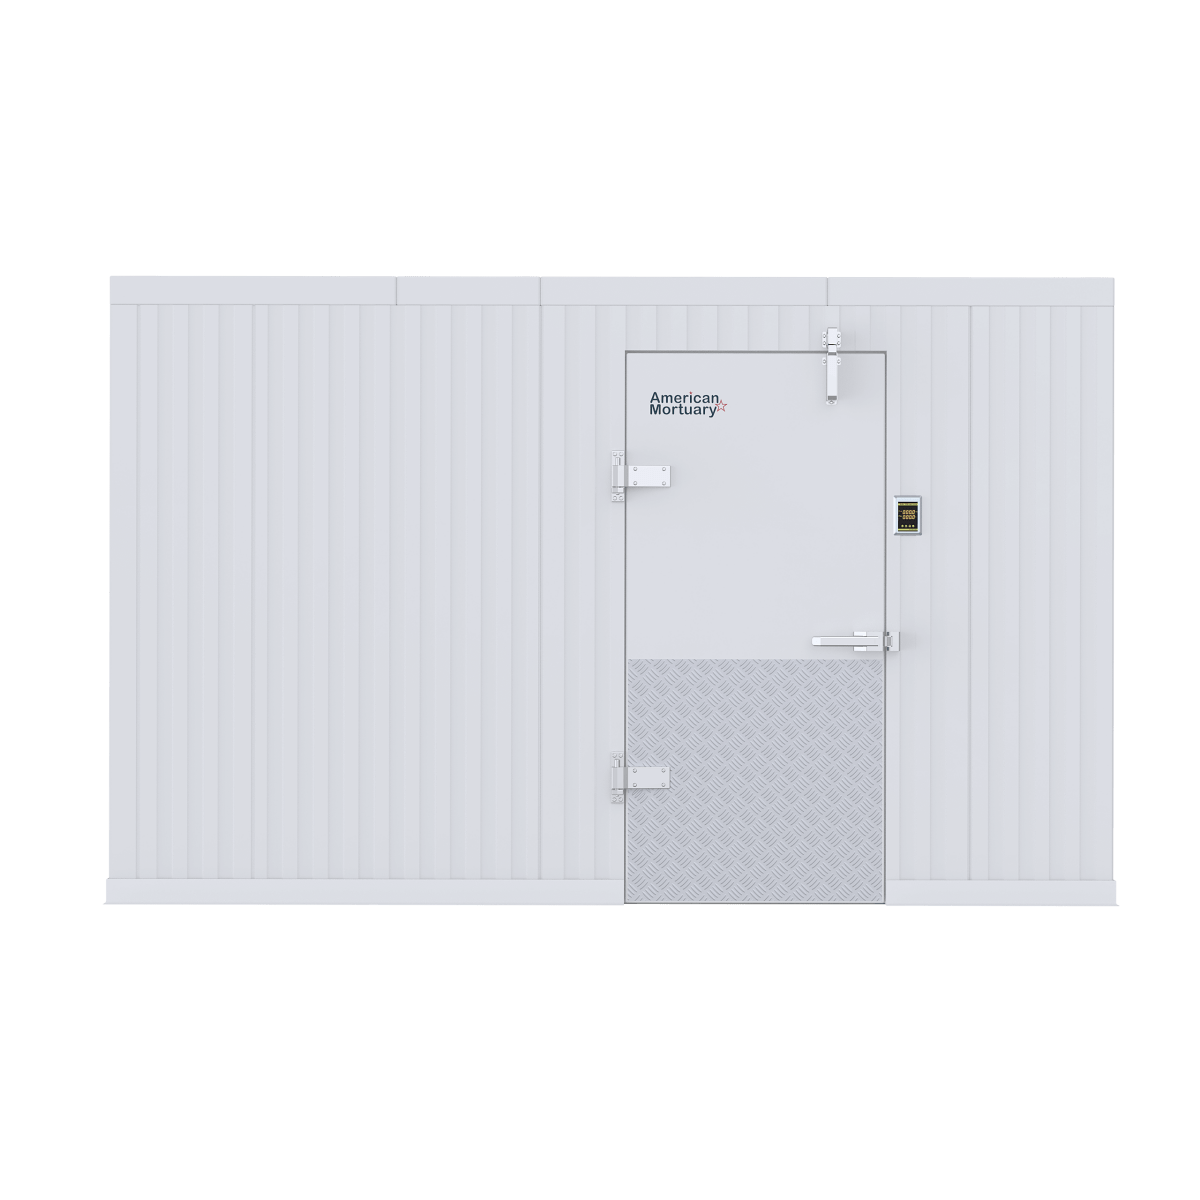
I'm Mortuary Cooler, and I've spent years helping funeral directors understand refrigeration systems and r404 pt chart applications for their cooling equipment. My experience with mortuary coolers has taught me that accurate pressure-temperature data is crucial for maintaining the reliable operation these facilities depend on.
Similar topics to r404 pt chart:
Understanding the R404A PT Chart & Core Data
When you're working with R404A refrigerant, you're dealing with something pretty sophisticated. This isn't just a simple gas—it's actually a carefully engineered blend of three different refrigerants mixed together in precise proportions.
R404A contains 44% R125, 4% R134a, and 52% R143a by weight. Think of it like a recipe where each ingredient brings something special to the table. This combination creates a refrigerant that works exceptionally well in low and medium-temperature applications, which is exactly why we use it in the mortuary coolers we build here at American Mortuary Coolers.
Now, let's talk about the environmental side of things. R404A has a Global Warming Potential (GWP) of 3,922, which is honestly pretty high compared to newer alternatives hitting the market. The good news? Its Ozone Depletion Potential (ODP) is 0, so it won't harm the ozone layer. It also carries an A1 safety classification, meaning it's non-toxic and non-flammable under normal conditions—that's peace of mind when you're working with it.
The critical temperature sits at 161.7°F, and here's something that makes R404A relatively easy to work with: it has a temperature glide of only about 0.5°F. For a blended refrigerant, that's impressively small. This minimal glide means R404A behaves almost like a pure refrigerant in most situations, making your job as a technician much more straightforward.
For more detailed information about R404A's properties and applications, check out our comprehensive guide: More info about R404A refrigerant.
What the R404A PT Chart Shows
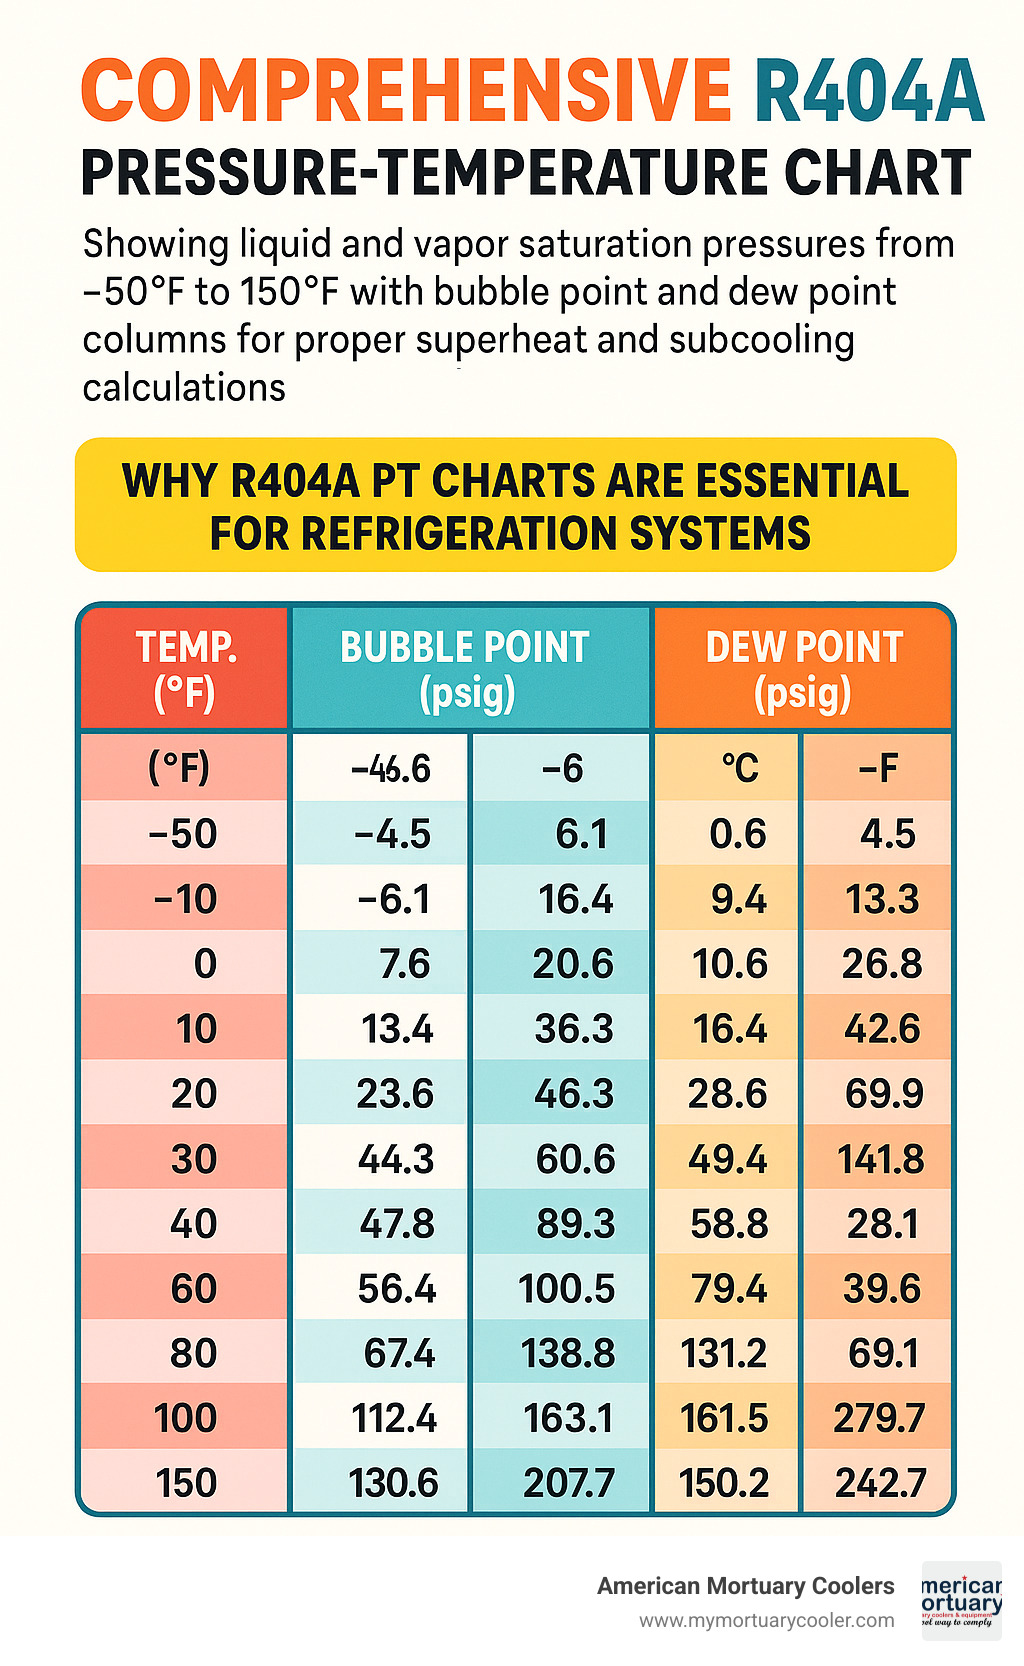
The r404 pt chart is your window into understanding exactly what's happening inside a refrigeration system. It displays both liquid saturation and vapor saturation pressures across a wide temperature range, typically from -50°F all the way up to 150°F.
Here's where things get interesting compared to single-component refrigerants. Because R404A is a blend, you'll see dual columns on the chart. This isn't just extra information—it's absolutely essential for accurate diagnosis and charging.
The liquid saturation column tells you the pressure at which R404A starts to vaporize at any given temperature. The vapor saturation column shows you the pressure where R404A finishes vaporizing completely. This distinction becomes crucial when you're trying to figure out what's really going on in a system that's not performing correctly.
Most professional charts you'll encounter include both Fahrenheit and Celsius scales, with pressure values shown in psig (pounds per square inch gauge). Some charts go the extra mile and include absolute pressure values and metric equivalents too.
Bubble Point vs Dew Point Explained
If you're going to master working with blended refrigerants like R404A, you absolutely need to understand bubble and dew points. Don't worry—it's simpler than it sounds.
The bubble point is the temperature and pressure where the first tiny vapor bubble forms in liquid refrigerant. Picture heating up liquid R404A until that first bubble appears—that's your bubble point. For subcooling calculations, this is your reference point from the PT chart.
The dew point works in reverse. It's where the first liquid droplet forms when you're cooling down refrigerant vapor. When you're calculating superheat, the dew point (vapor saturation) values are what you need from the chart.
Here's the beauty of R404A's small temperature glide: there's minimal risk of fractionation during normal operation. That said, proper technique still matters. You should always use liquid-phase charging to maintain the correct blend ratio and keep your system running as designed.
The small glide also means you won't see dramatic differences between bubble and dew point readings, but those small differences still matter when you're trying to dial in system performance perfectly.
Mastering Field Use of the r404 pt chart
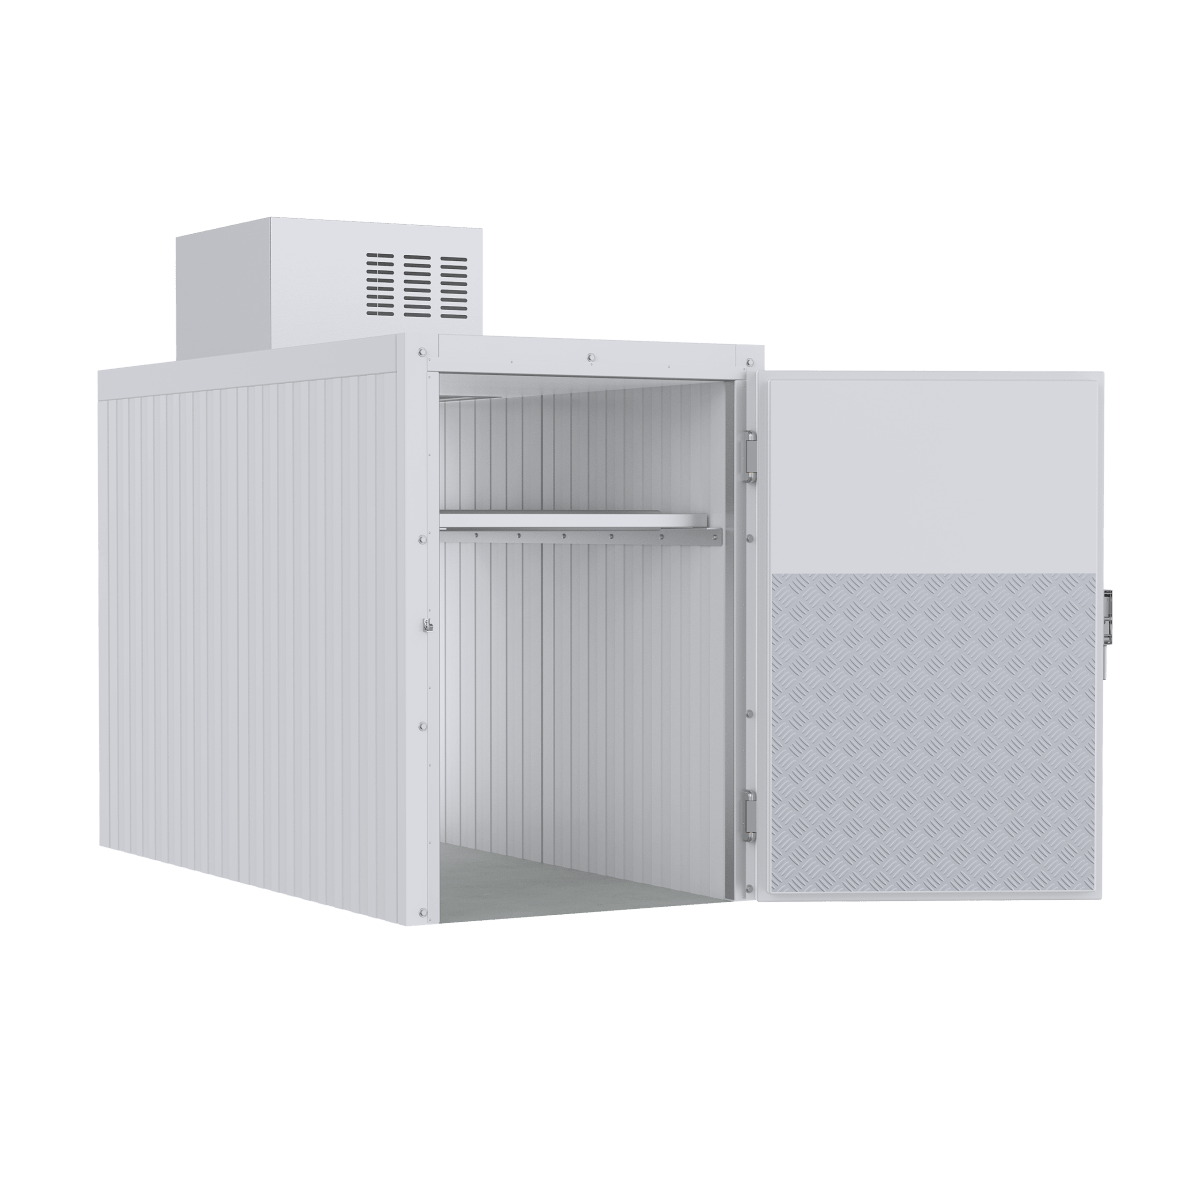
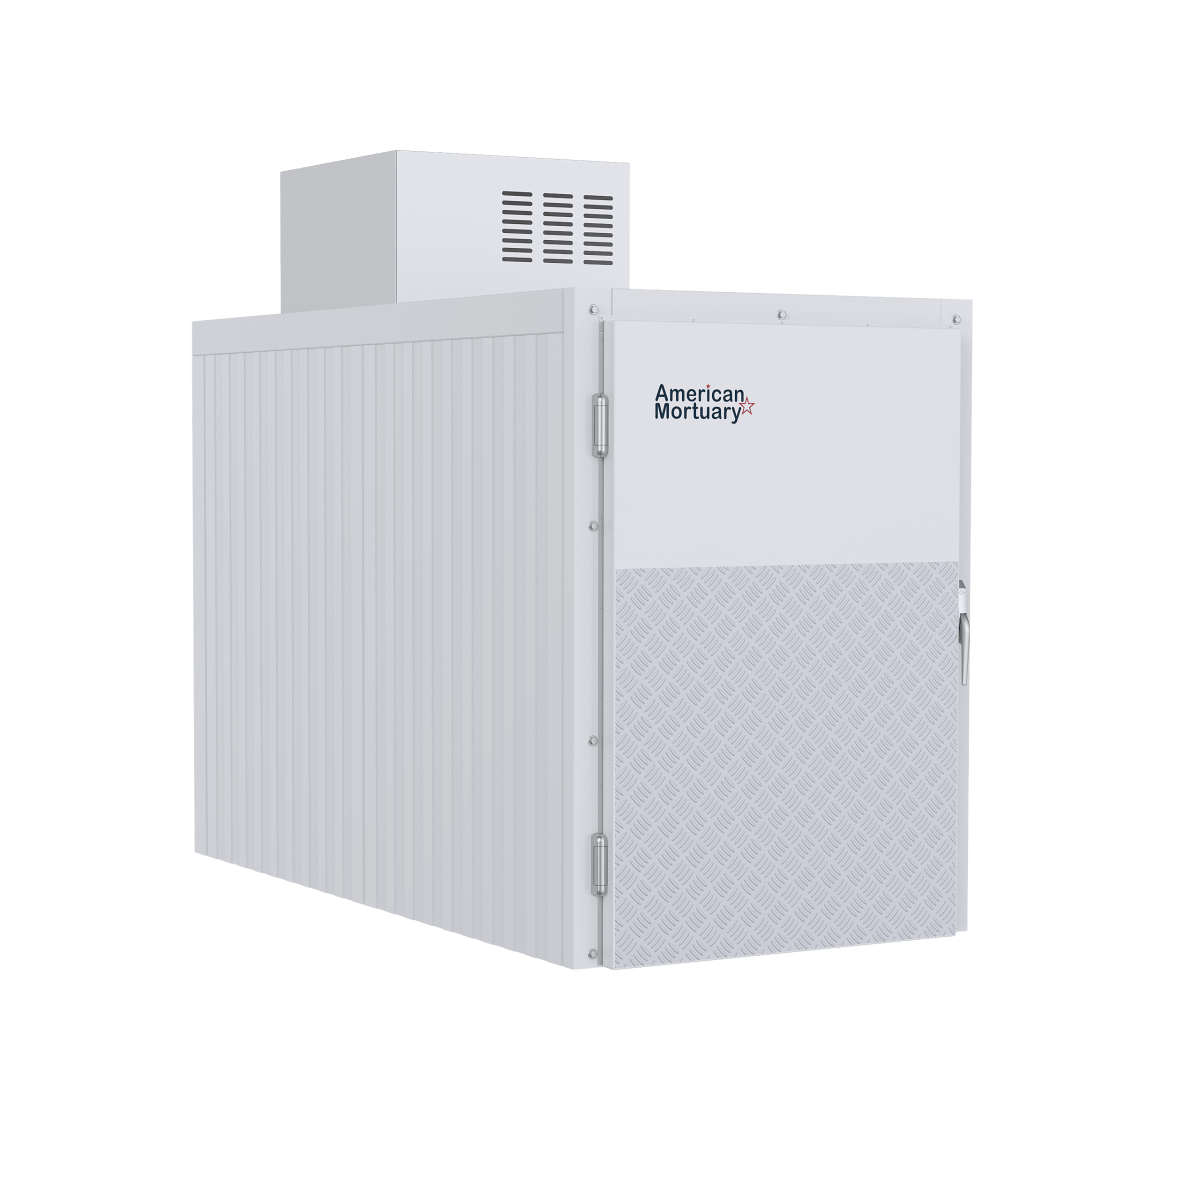
When you're out in the field working with R404A systems, you'll encounter this refrigerant in some pretty demanding applications. Walk-in freezers at restaurants keep ingredients fresh, supermarket display cases showcase frozen foods under bright lights, and mortuary coolers maintain precise temperatures for funeral homes. Each of these systems depends on accurate pressure-temperature relationships to work efficiently.

Here's something many technicians overlook: altitude makes a real difference in your readings. If you're working in Denver or any location above sea level, your r404 pt chart values need adjustment. The rule of thumb is simple - subtract about 0.5 psi for every 1,000 feet of elevation. This accounts for the thinner air that affects your gauge readings.
Unit conversions can trip you up if you're not careful. Some gauges read in psig, others in psia, and international equipment might show bar or kPa. Always double-check what your gauges are showing before making any adjustments. A quick mistake here can lead to hours of troubleshooting later.
For quick access to various PT charts when you're on the road, bookmark this helpful resource: PT Chart Selection.
How to Read the r404 pt chart Step-by-Step
Reading an r404 pt chart correctly is like following a recipe - miss a step and your results won't be right. Start by attaching your manifold gauges to the system's service ports. Make sure those connections are tight and your gauges are properly calibrated.
Next, turn off the unit and wait about 10-15 minutes for the pressures to equalize throughout the system. This step is crucial because you need the refrigerant in a saturated state for accurate readings.
Now comes the chart work. Find the temperature row that matches what you're measuring - whether that's ambient temperature, coil temperature, or line temperature. Read across to the pressure column you need. Use the liquid (bubble) column for subcooling calculations and the vapor (dew) column for superheat.
Finally, convert units if needed to match your specific gauges or system requirements. This systematic approach prevents the common errors that can throw off your entire diagnosis.
Calculating Superheat & Subcooling with the r404 pt chart
Superheat calculations are where the vapor (dew) column becomes your best friend. Measure the actual temperature of your suction line, then subtract the saturation temperature from your PT chart at that pressure. Most R404A systems run best with superheat between 8-12°F.
For subcooling, flip to the liquid (bubble) column. Take your measured liquid line temperature and subtract it from the saturation temperature at your measured head pressure. You're typically shooting for around 10°F of subcooling for optimal performance.
These calculations tell you whether your system has the right refrigerant charge and if heat transfer is happening properly. Getting them right can save you from callback visits and unhappy customers.
For a deeper dive into these calculations with practical examples, check out our detailed guide: A Quick Start Guide to R404 Pressure Temperature Charts.
Altitude Adjustments & Ambient Factors
Working at altitude throws a curveball at your standard PT chart readings. Barometric pressure drops as you go higher, and since most refrigeration gauges read relative to atmospheric pressure, your numbers will be off.
At 5,000 feet elevation, you'll need to subtract 2.5 psi from your standard sea-level chart values. At 8,000 feet, that becomes 4 psi. It's not huge, but it's enough to affect your superheat and subcooling calculations.
Ambient conditions also play a role that many technicians underestimate. High humidity can mess with heat transfer rates and make temperatures seem different than they actually are. Very dry conditions might give you higher static pressure readings than expected.
In our experience building mortuary coolers for facilities across different climates and elevations, these environmental factors can make the difference between a system that runs reliably and one that struggles to maintain proper temperatures.
Quick Reference Pressure-Temperature Values for Technicians
When you're working in the field, having quick access to r404 pt chart values can save valuable time during system diagnosis and charging procedures. These pressure-temperature relationships are the backbone of proper R404A system operation.
The most frequently referenced values span from typical freezer temperatures up to high ambient conditions. At -20°F, you'll see 4.3 psig, which is common for walk-in freezers and our mortuary coolers. Moving up the temperature scale, 0°F corresponds to 32.6 psig, a reference point many technicians memorize for quick field calculations.
For medium-temperature applications, 20°F produces 58.1 psig, while 40°F jumps to 85.4 psig. These values are crucial when working on display cases or reach-in coolers. When ambient temperatures climb, 80°F reaches 193.5 psig, and extreme conditions at 100°F push pressures to 234.6 psig.
Understanding the difference between bubble and dew points becomes practical when you see the actual numbers. At 0°F, the bubble point sits at 32.6 psig while the dew point measures 32.4 psig - only a 0.2 psi difference. This pattern holds consistent across the temperature range, with 40°F showing 85.4 psig bubble versus 85.2 psig dew, and 100°F displaying 234.6 psig bubble compared to 234.4 psig dew.
This minimal 0.2 psi difference demonstrates why R404A behaves almost like a pure refrigerant despite being a blend. The low glide makes field calculations straightforward and reduces the risk of fractionation during normal operation.
Printable Resources & Mobile Apps
Smart technicians keep multiple resources handy for quick r404 pt chart reference. The HVAC Buddy® app stands out as a comprehensive mobile solution with built-in PT charts and calculation tools that work offline - perfect when you're in a basement mechanical room with poor cell service.
For those who prefer paper references, printable PDF charts offer reliability that doesn't depend on battery life or screen visibility in bright sunlight. Many experienced techs laminate these charts for durability in harsh working conditions.
Online calculators provide interactive tools for quick pressure-temperature conversions, especially useful when working with mixed unit systems or international equipment specifications.
Access the mobile-friendly HVAC Buddy® R404A chart here: R-404A Pressure Temperature Chart - HVAC Buddy®
For a field-ready printable version, download the professional chart from: IGA PDF PT Chart
Having these resources readily available ensures you can quickly verify system performance, calculate superheat and subcooling values, and make informed charging decisions regardless of your location or working conditions.
Charging, Troubleshooting & Safety Best Practices
When it comes to charging R404A systems, liquid-phase charging is absolutely critical. This isn't just a best practice recommendation—it's essential for preventing fractionation of the refrigerant blend. The three components in R404A have slightly different boiling points, so charging through the vapor phase can alter the blend ratio and reduce system efficiency.
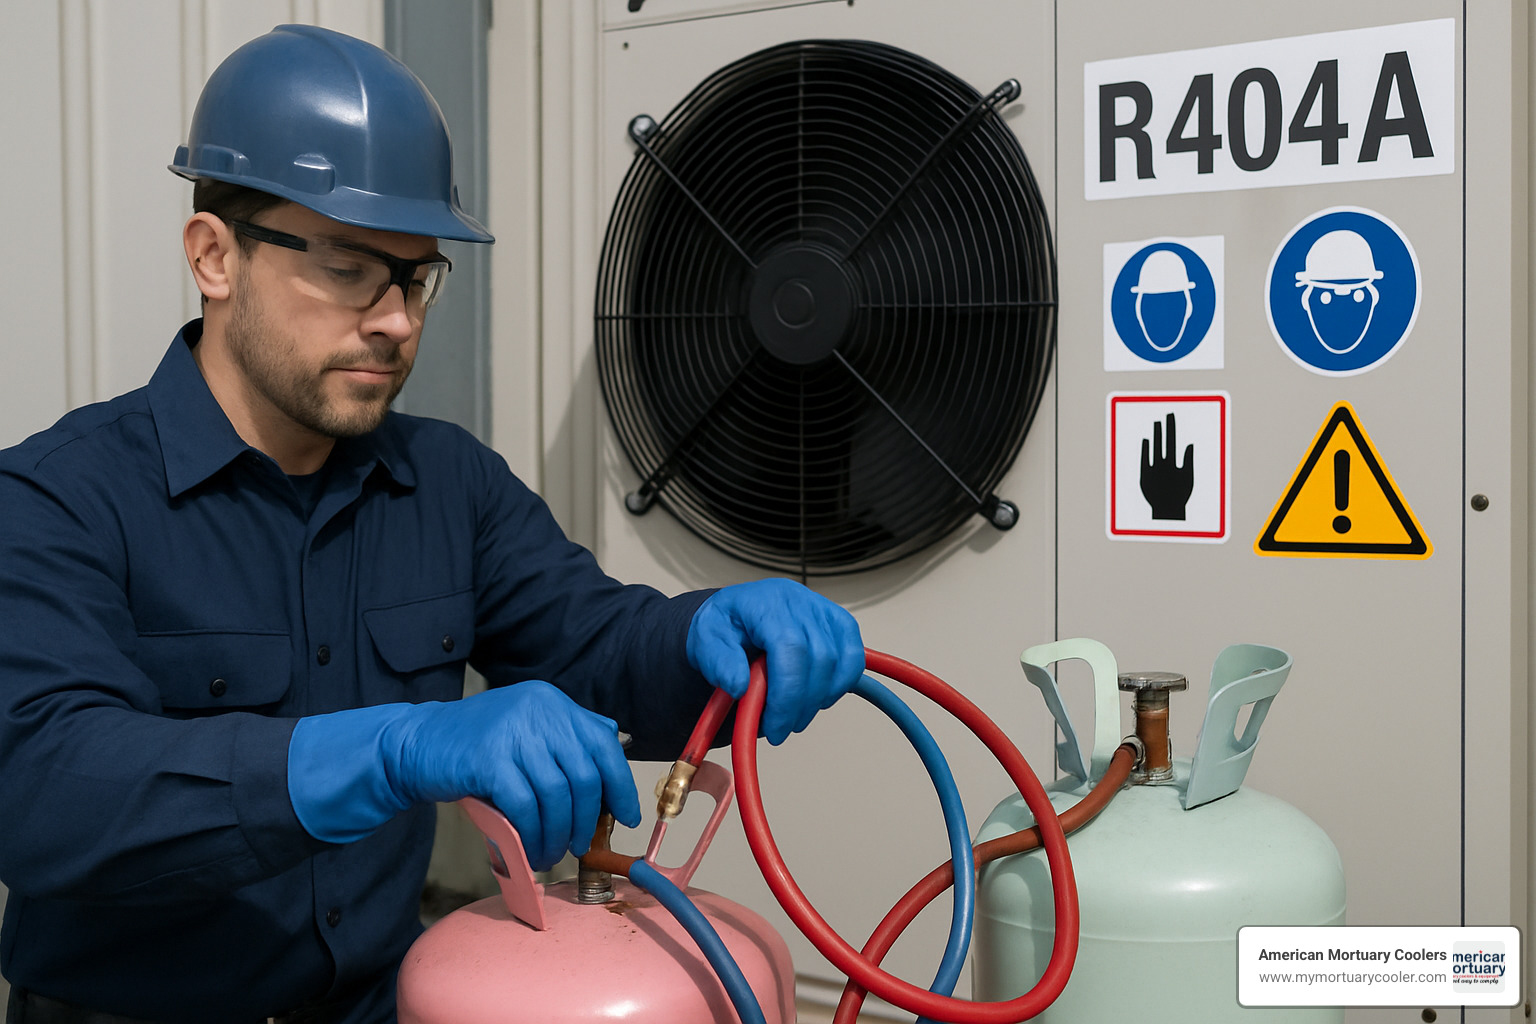
Always charge through the liquid line or use a charging cylinder to maintain the correct blend composition. Your r404 pt chart readings will only be accurate if the system contains the proper refrigerant mixture—something that's impossible to achieve with vapor charging.
R404A systems require polyolester (POE) oil exclusively. This synthetic oil is hygroscopic, meaning it absorbs moisture from the air like a sponge. Never mix POE with mineral oil or alkylbenzene oils from older R-22 systems. The chemical incompatibility can cause acid formation and compressor failure.
Leak detection becomes especially important with high-GWP refrigerants like R404A. A small leak that might have been acceptable with older refrigerants now represents a significant environmental concern. Use electronic leak detectors specifically calibrated for HFC refrigerants, and always wear proper personal protective equipment including safety glasses and insulated gloves.
The most common charging errors we see include overcharging systems, using the wrong column on the PT chart, and forgetting altitude corrections. Remember: more refrigerant doesn't equal better performance. In fact, overcharging typically reduces efficiency and can damage compressors.
For comprehensive guidance on R404A system management, check out our detailed resource: More info about r404a pt chart guide.
Common Mistakes Technicians Make
After years of working with mortuary cooling systems, I've seen these errors repeatedly in the field. Using the wrong PT chart column tops the list—technicians often confuse which column to use for superheat versus subcooling calculations. Remember: bubble point for subcooling, dew point for superheat.
Ignoring temperature glide might seem minor with R404A's small 0.5°F glide, but it can affect accuracy in critical applications like mortuary coolers where precise temperature control is essential. Even small variations matter when you're maintaining optimal storage conditions.
System overcharging remains surprisingly common. Some technicians assume that adding extra refrigerant provides a safety margin, but this actually reduces system efficiency and increases operating pressures beyond safe limits.
Altitude adjustments get forgotten more often than you'd expect, especially when technicians travel between different elevation zones. That 0.5 psi per 1,000 feet correction can make the difference between accurate diagnostics and chasing phantom problems.
Temperature scale confusion between Celsius and Fahrenheit has caused more troubleshooting headaches than I can count. Always double-check that your measurements match the scale on your PT chart.
Safety Considerations with High-Pressure Refrigerants
R404A operates at significantly higher pressures than older refrigerants like R-22. At 100°F, R404A reaches 234.6 psig compared to R-22's 196 psig at the same temperature. This 20% pressure increase demands extra caution in handling and system work.
Cylinder transport and storage require special attention. Never expose R404A cylinders to temperatures above 125°F, and always transport them upright with valve protection caps installed. The higher operating pressures mean cylinder failures can be more dangerous than with lower-pressure refrigerants.
Eye and hand protection aren't optional when working with R404A. Direct contact with liquid refrigerant can cause severe frostbite, and pressurized releases can cause serious eye injuries. I always keep safety glasses and insulated gloves within arm's reach when working on systems.
Proper ventilation becomes critical because R404A is heavier than air and can displace oxygen in confined spaces like equipment rooms or basements. This is especially important in funeral homes where equipment rooms are often in lower levels of buildings.
Recovery procedures should minimize environmental release of this high-GWP refrigerant. Use proper recovery equipment and follow EPA guidelines for refrigerant handling. The environmental impact of R404A releases is substantial, making leak prevention and proper recovery essential for responsible service work.
R404A vs Other Refrigerants & Future Alternatives
The refrigeration industry is undergoing a significant change, and R404A's days are numbered. With the AIM Act phase-down targeting high-GWP refrigerants, we're seeing a wave of alternatives that promise to deliver similar performance while dramatically reducing environmental impact.
R448A leads the pack as the most practical near-term replacement. This clever blend offers a whopping 65% GWP reduction, dropping from R404A's hefty 3,922 down to a more manageable 1,274. What makes R448A particularly attractive is its ability to work as a drop-in replacement in many existing systems - no major retrofits required.
R452A takes a more moderate approach with a 45% GWP reduction (GWP 2,141), but it's specifically engineered for transport refrigeration applications. If you're working on delivery trucks or refrigerated trailers, R452A might be your best bet for the transition period.
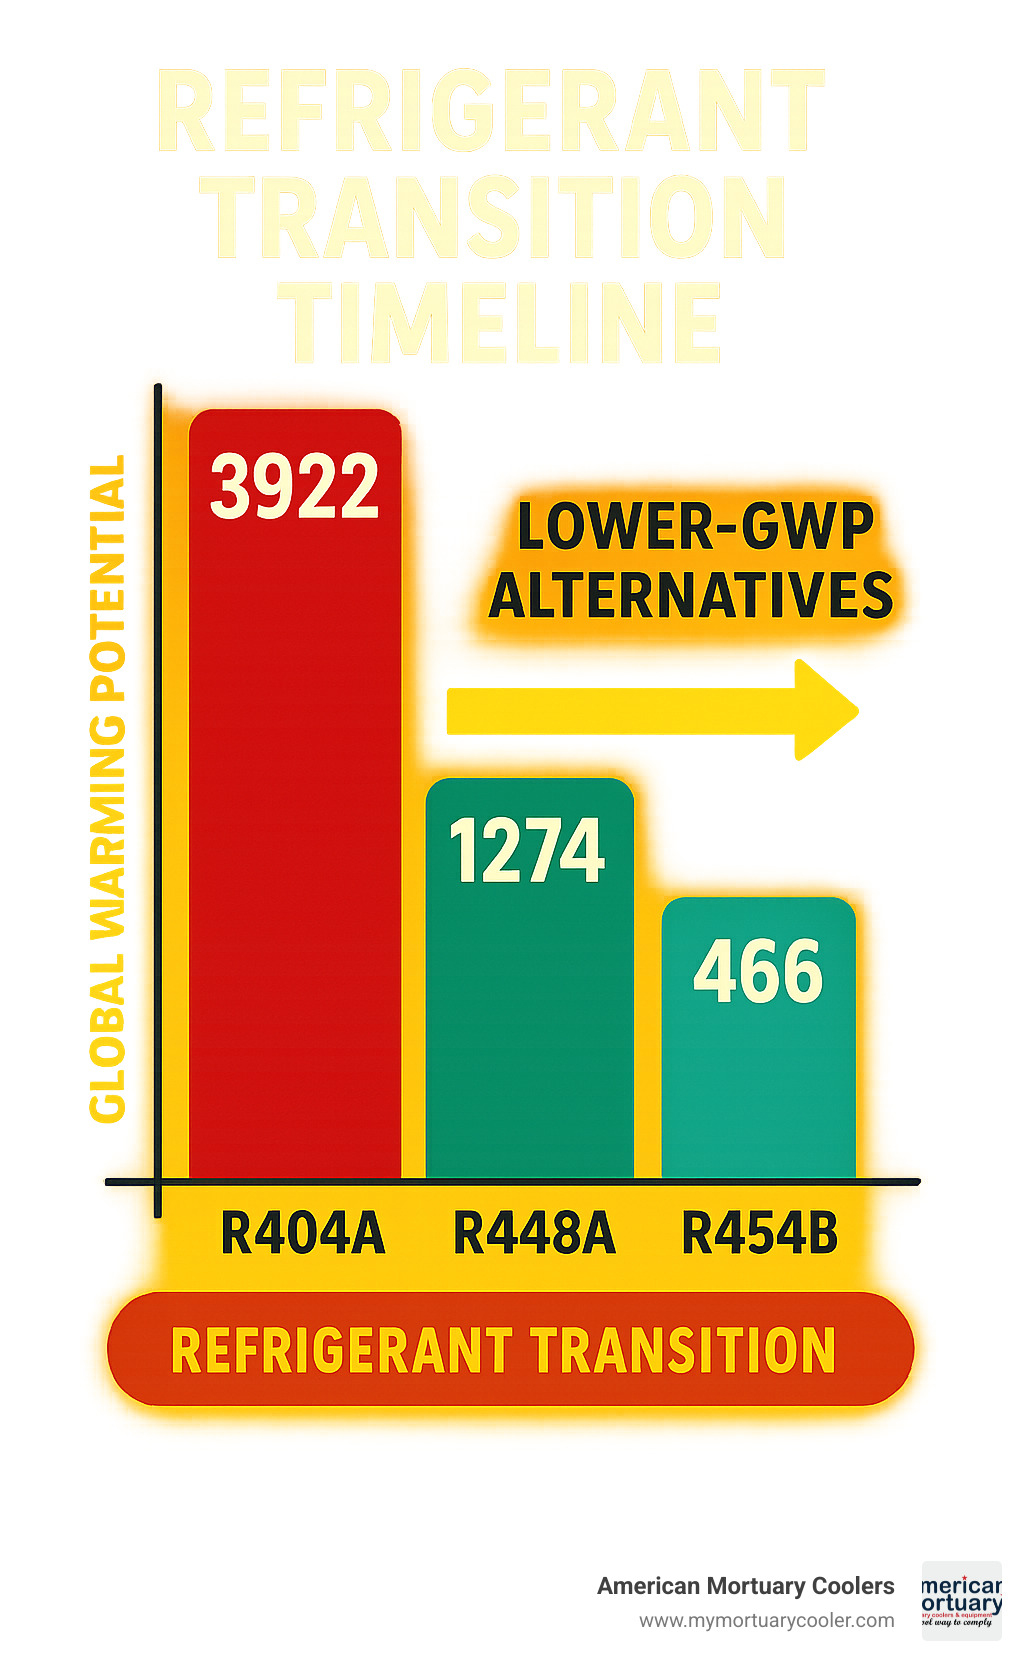
R454B represents the future of commercial refrigeration with an impressive GWP of only 466 - that's an 88% reduction from R404A. However, there's a catch: it carries an A2L safety classification due to mild flammability. This means additional safety considerations and potentially different installation requirements.
When comparing these alternatives to your familiar r404 pt chart values, the pressure differences are relatively modest. At 40°F, R404A runs at 85.4 psig, while R448A operates at 83.2 psig and R452A at 84.1 psig. The outlier is R454B at 177.3 psig for liquid saturation - a significant jump that requires careful system design considerations.
At American Mortuary Coolers, we're watching these developments because our customers depend on reliable, long-term cooling solutions. The funeral industry can't afford equipment failures, so we're evaluating each alternative thoroughly before making recommendations for new installations.
R410A remains popular in some applications, but it's not ideal for low-temperature work where R404A traditionally excels. Its pressure characteristics and temperature range make it better suited for air conditioning applications than mortuary cooling.
The transition timeline varies by application and region, but the writing is on the wall. New installations are increasingly specifying lower-GWP alternatives, while existing R404A systems will likely run on reclaimed refrigerant as supplies tighten.
For detailed pressure-temperature data on R452A, check out this comprehensive resource: R-452A XP44 Refrigerant PT Chart - Refrigerant HQ.
The key is planning ahead. Whether you're maintaining existing R404A equipment or specifying new systems, understanding the performance characteristics and availability of these alternatives will help you make informed decisions for your specific applications.
Frequently Asked Questions about the R404 PT Chart
Working with r404 pt charts can feel overwhelming at first, but most technicians have similar questions when they're getting started. I've been helping funeral directors and HVAC professionals understand these charts for years, and these are the questions that come up most often.
What pressure should R404A be at 0°F?
At 0°F (-17.8°C), your manifold gauges should read approximately 32.6 psig for R404A. This is probably the most important number to memorize if you're working with walk-in freezers or mortuary coolers regularly.
This pressure point is so commonly referenced because many low-temperature refrigeration systems operate right around the freezing mark. When I'm troubleshooting one of our mortuary coolers, this is often my first checkpoint.
Which column do I use for superheat?
Always use the dew point (vapor) column when calculating superheat. Think of it this way: superheat measures how much heat you've added to vapor that's already completely evaporated, so you need the vapor saturation temperature as your starting point.
I see technicians mix this up all the time, especially when they're used to working with single-component refrigerants. With R404A's blended nature, using the wrong column can throw off your calculations by several degrees.
How does altitude change my readings?
Here's where things get interesting - subtract approximately 0.5 psi per 1,000 feet of elevation from your standard PT chart values. So if you're working at 5,000 feet above sea level, that 0°F reading drops from 32.6 psig to about 30.1 psig.
This happens because atmospheric pressure decreases with altitude, and your gauges read pressure relative to the surrounding air pressure. Don't forget to recalibrate your gauges periodically if you're constantly moving between different elevations.
What's the difference between R404A liquid and vapor pressures?
The beauty of R404A is its minimal temperature glide - only about 0.5°F. This means the difference between liquid (bubble point) and vapor (dew point) pressures is typically just 0.2 to 0.3 psi at most operating temperatures.
This small difference is why R404A behaves almost like a pure refrigerant in most situations. It's much easier to work with than some other blended refrigerants that have significant pressure differences between their liquid and vapor phases.
Can I use R404A PT charts for other refrigerants?
Absolutely not - each refrigerant has its own unique pressure-temperature relationship. Using an r404 pt chart for R410A, R22, or any other refrigerant will give you completely wrong readings and could lead to serious system damage.
I've seen technicians accidentally grab the wrong chart and wonder why their system isn't performing correctly. Always double-check that your chart matches the refrigerant nameplate on the equipment.
What happens if I overcharge based on PT readings?
Overcharging pushes your head pressure way beyond normal PT chart values, which kills system efficiency and can destroy compressors. The refrigerant might still follow the pressure-temperature relationship, but you'll be operating at dangerously high pressures.
PT charts show saturation conditions - they don't tell you how much refrigerant to put in the system. Always follow the manufacturer's charging specifications rather than trying to hit specific pressures from the chart. Our mortuary coolers, for example, have specific charge weights that ensure optimal performance regardless of what the PT chart shows.
Conclusion
Mastering the r404 pt chart isn't just about memorizing pressure values—it's about understanding the heart of every refrigeration system you touch. Whether you're troubleshooting a stubborn walk-in freezer at 2 AM or commissioning a brand-new mortuary cooler, these pressure-temperature relationships are your roadmap to success.
Here at American Mortuary Coolers, we've seen how proper PT chart knowledge separates the pros from the weekend warriors. Our custom mortuary cooling solutions depend on technicians who understand that accurate charging and maintenance using reliable PT data makes the difference between a system that runs for years and one that fails when families need it most.
From our Tennessee headquarters to our service areas spanning Atlanta, Chicago, Columbia, Dallas, Los Angeles, New York, and Pittsburgh, we work with technicians across the contiguous 48 states. The one thing they all have in common? They know their PT charts inside and out.
The refrigeration industry is changing fast. High-GWP refrigerants like R404A are being phased down, but existing systems will keep humming for decades to come. Learning proper PT chart techniques today sets you up for success with both current systems and the newer alternatives coming down the pipeline.
Keep these fundamentals locked in your memory: bubble point values for subcooling, dew point values for superheat, and always subtract that 0.5 psi per 1,000 feet when you're working at altitude. When something doesn't look right, trust your instincts and double-check against manufacturer specs.
Our durable custom mortuary coolers deliver optimal performance when charged using accurate R404A PT data—but only when technicians know how to read those charts correctly. That's why we created comprehensive resources to help you stay sharp.
Check out our detailed guide that covers everything from basic readings to advanced troubleshooting: A Quick Start Guide to R404a Pressure Charts and Values.
Keep those systems running strong, and remember—accurate PT data isn't just numbers on a chart. It's peace of mind for the families who depend on reliable refrigeration when they need it most.


