Why R404A Pressure Temperature Charts Matter for Mortuary Refrigeration
An r404 pressure temperature chart shows you the exact pressure readings you should see at any given temperature for R404A refrigerant systems. Here's what you need to know:
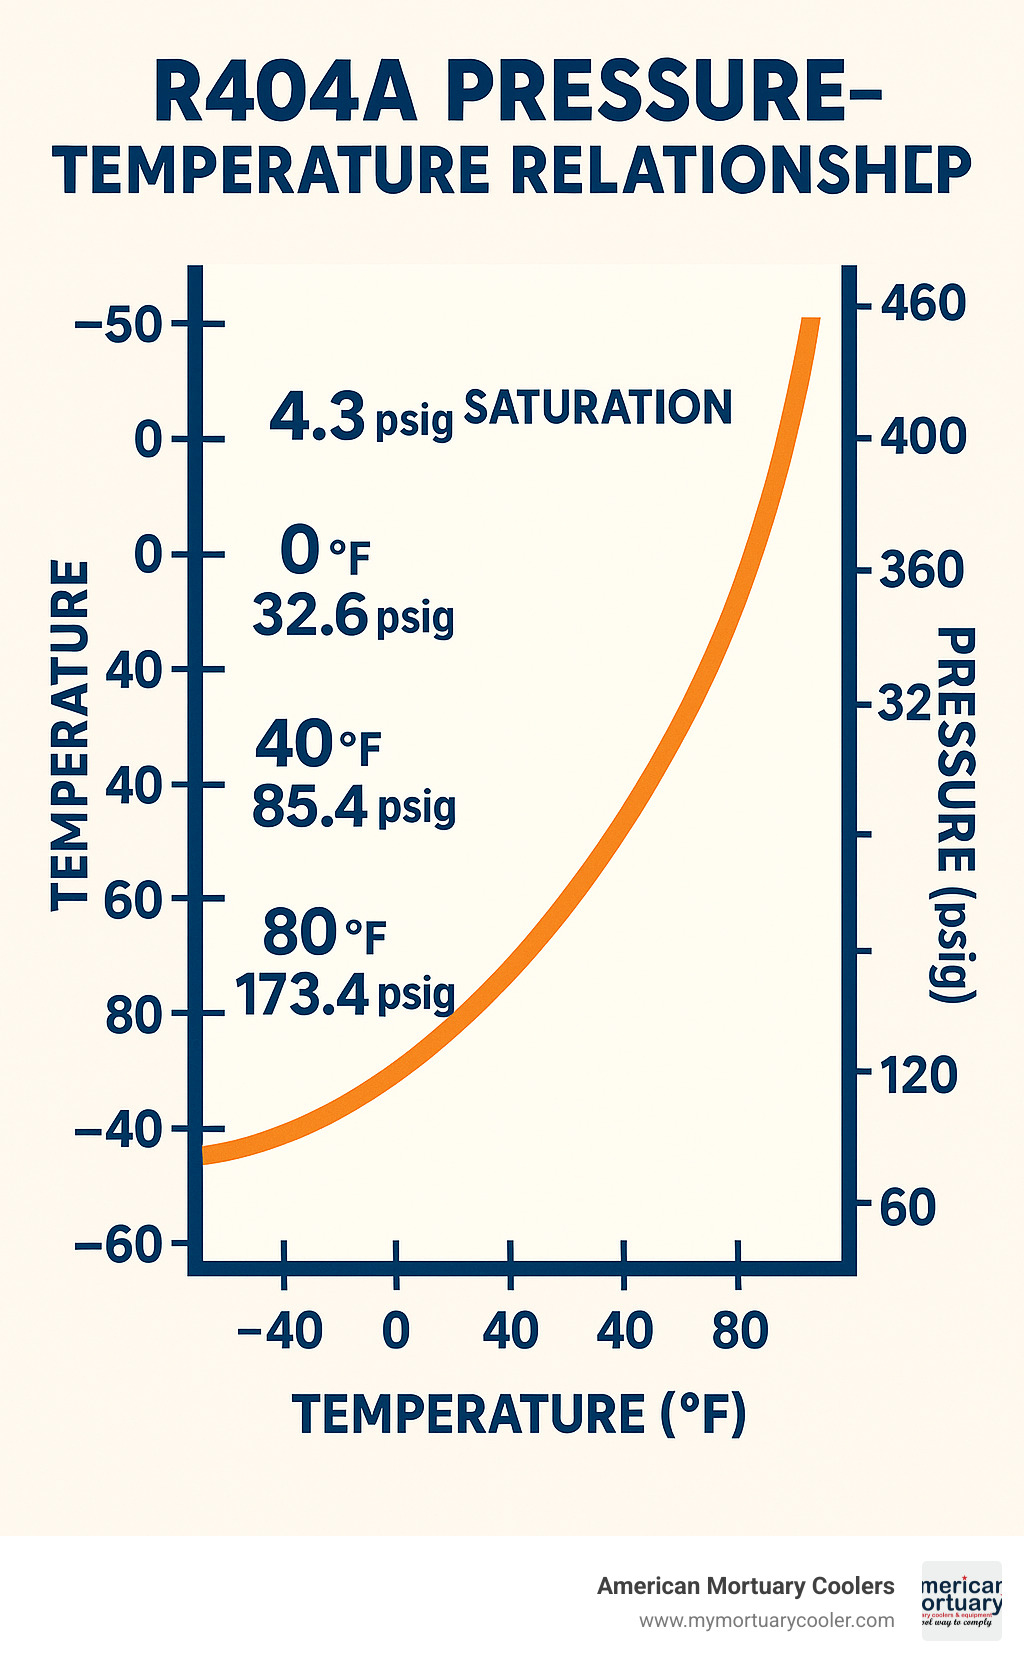
Key R404A Pressure Values:
- -40°F: 4.3 psig
- 0°F: 32.6 psig
- 40°F: 85.4 psig
- 80°F: 173.4 psig
- 100°F: 234.6 psig
Critical Properties:
- Boiling point: -51.8°F at atmospheric pressure
- Critical temperature: 161.7°F
- Critical pressure: 540.8 psi
- Temperature glide: 7°F (zeotropic blend)
When you're servicing mortuary coolers, walk-in freezers, or other commercial refrigeration equipment, the r404 pressure temperature chart becomes your roadmap for proper system charging, troubleshooting pressure issues, and ensuring optimal performance. R404A is a popular HFC refrigerant blend used in low and medium-temperature applications because it replaced older refrigerants like R502 and R22.
The chart works because refrigerants have a direct relationship between their saturation temperature and pressure - when one changes, the other follows predictably. This relationship lets you diagnose problems, verify proper refrigerant charge levels, and set safety controls with confidence.
I'm with American Mortuary Coolers, a national-level mortuary cooler supplier with extensive experience helping funeral home directors maintain their refrigeration systems using r404 pressure temperature chart data for optimal performance. My background in commercial refrigeration has shown me how critical accurate pressure readings are for reliable mortuary equipment operation.
Find more about r404 pressure temperature chart:
How This Guide Will Help
This quick-start guide will take you from zero to confident when working with r404 pressure temperature charts. We'll cover everything step-by-step, from understanding what R404A is to applying the chart data in real-world scenarios. Whether you're charging a system, troubleshooting a problem, or just want to understand what those pressure readings mean, we've got you covered with pro tips from our years of experience servicing mortuary coolers across the contiguous 48 states.
You'll learn to read the charts like a pro, understand the difference between bubble and dew points, and know exactly what pressures to expect at any temperature. Plus, we'll share safety considerations and regulatory information that keeps you compliant and your equipment running smoothly.
What Is R404A and Why Use a Pressure-Temperature Chart?
Think of R404A as the workhorse of commercial refrigeration. This isn't just one refrigerant - it's actually a carefully crafted blend of three different HFC refrigerants mixed together like a recipe: 44% R125, 4% R134a, and 52% R143a by weight. The engineers who created this blend knew exactly what they were doing.
Back in the day, refrigeration systems relied heavily on R502 and R22. But when environmental regulations started tightening up, the industry needed something better. That's where R404A stepped in as the hero. With its boiling point of -51.8°F at atmospheric pressure, this refrigerant absolutely excels when you need to keep things seriously cold.
Now, let's talk about the elephant in the room. R404A has a Global Warming Potential (GWP) of 3922, which sounds scary but was actually a huge improvement over the ozone-depleting refrigerants it replaced. It has zero ozone depletion potential, making it an excellent bridge technology. Today's AIM Act regulations are pushing us toward even lower-GWP alternatives, but R404A still plays a crucial role in many systems.
Here's where the science gets interesting. When your refrigerant exists in perfect balance between liquid and vapor phases, it's at what we call saturation. At this magical point, temperature and pressure are locked together in a dance - change one, and the other follows predictably. This is exactly what an r404 pressure temperature chart captures for you.
The chart shows you the precise pressure you'll see at any given saturation temperature. It's like having a crystal ball for your refrigeration system. When your system reaches equilibrium, these pressure-temperature relationships become your roadmap for understanding what's happening inside those copper lines.
For more background on how these systems actually work their magic, check out our A Comprehensive Guide to Refrigeration Units and How They Work.
Common Applications for R404A
Walk into any commercial kitchen, and you'll likely find R404A hard at work. Walk-in freezers love this refrigerant because it handles low temperatures like a champ. Those supermarket display cases keeping your ice cream perfectly frozen? Probably running on R404A. Ice machines churning out cubes for restaurants rely on it too.
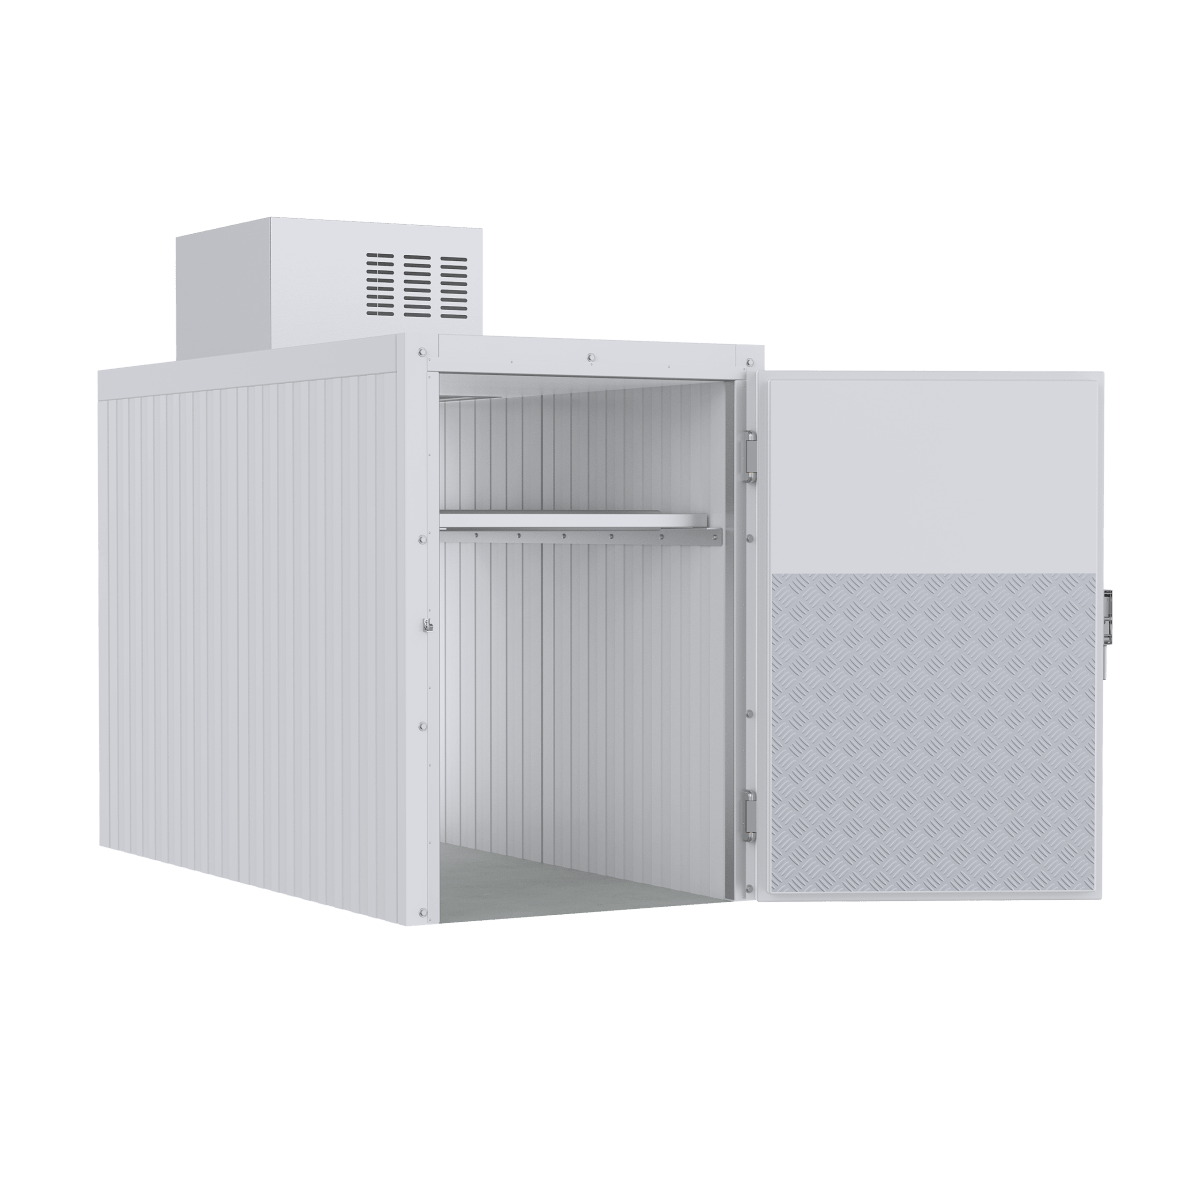
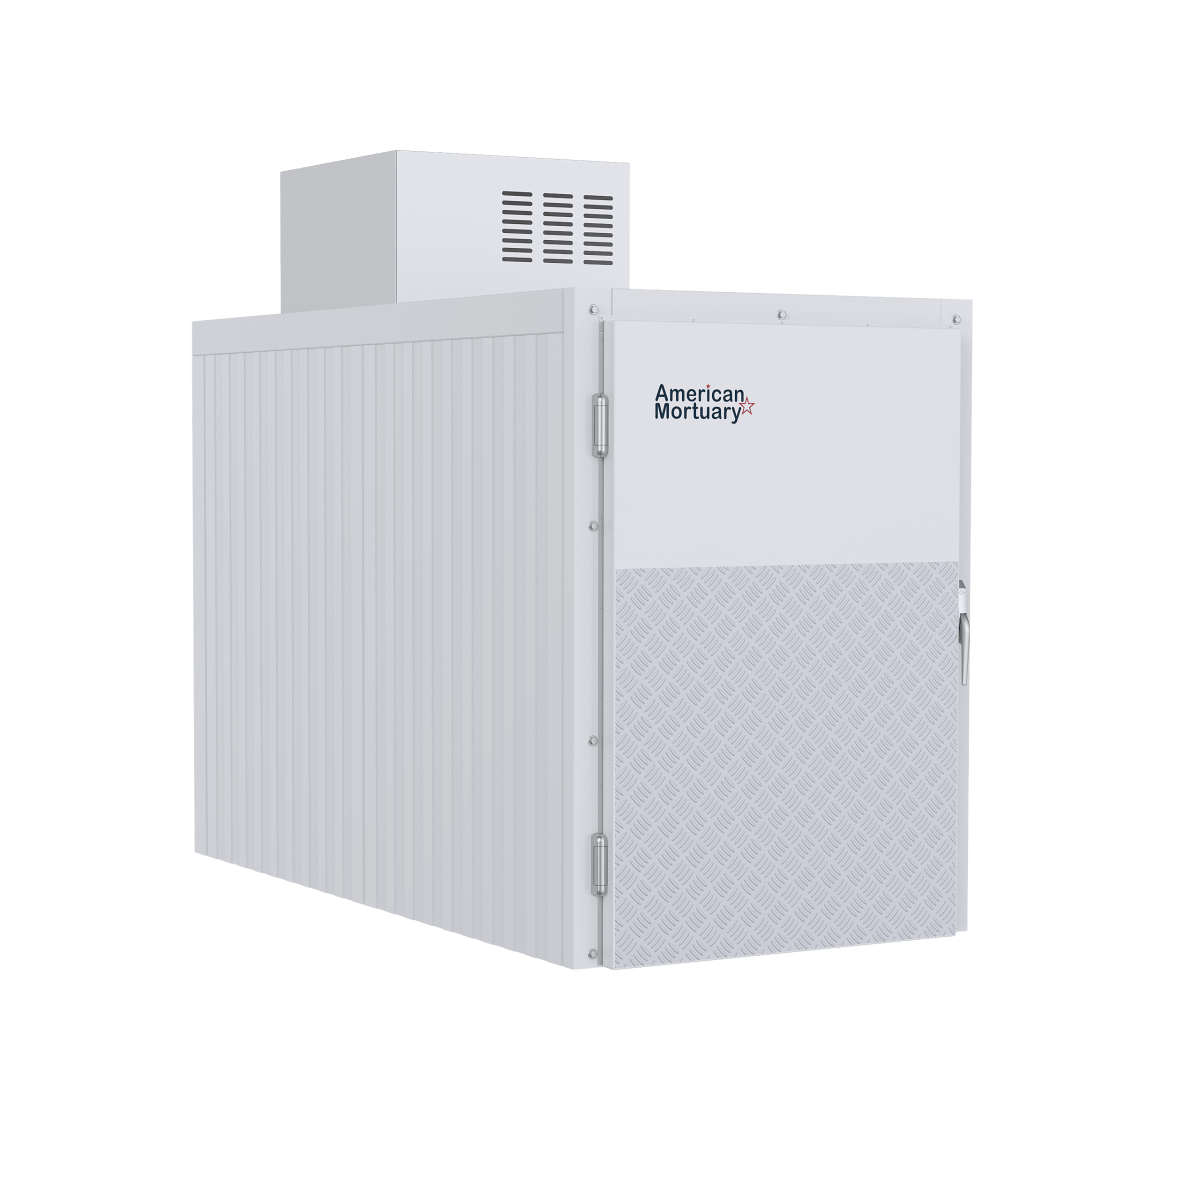
At American Mortuary Coolers, we've installed R404A systems in mortuary coolers from Tennessee all the way to California. When funeral homes need precise temperature control - often well below freezing - R404A delivers that reliability day after day, year after year. Our custom mortuary coolers depend on this refrigerant's consistent performance to maintain the exact conditions our clients require.
The beauty of R404A lies in its excellent low-temperature performance. While some refrigerants struggle when things get really cold, R404A actually thrives in these conditions. That's why it became the go-to choice for applications where failure simply isn't an option.
Why Technicians Rely on PT Charts
Without a proper r404 pressure temperature chart, charging a system accurately becomes pure guesswork. When you're adding refrigerant, you need to know exactly what pressure indicates the right charge level. Too little refrigerant means poor cooling performance and potential compressor damage from overheating. Too much can cause liquid slugging that'll kill your compressor faster than you can say "warranty void."
Troubleshooting becomes systematic with PT chart data in your toolkit. Picture this: you measure 85 psig on the low side, and you know the evaporator temperature should be 0°F. But your chart shows 85 psig corresponds to 40°F. Boom - you immediately know there's a problem, likely insufficient refrigerant flow or a restriction somewhere in the system.
Component sizing also depends on accurate pressure data. Relief valves need to be set correctly, pressure switches must trip at the right points, and all system components need proper pressure ratings. The r404 pressure temperature chart gives you the hard data to make these critical calculations with confidence.
Regulatory compliance isn't optional anymore. EPA requirements for proper charging, leak detection, and system maintenance all rely on accurate pressure readings. Having the right PT chart data keeps you compliant and your customers' systems running smoothly for years to come.
Understanding the R404 Pressure Temperature Chart
When you first look at an r404 pressure temperature chart, it might seem like just a bunch of numbers in rows and columns. But once you understand what you're looking at, it becomes one of your most valuable tools for refrigeration work.
Most charts show temperature values (in both Fahrenheit and Celsius) running down one side, with corresponding pressure readings across the top or bottom. You'll typically see pressures listed in psig (pounds per square inch gauge), though some charts also include bar or kPa measurements for international use.

Here's where R404A gets a bit tricky compared to pure refrigerants. Since it's a blend of three different HFCs, it doesn't behave like a single-component refrigerant. Instead of boiling at one exact temperature, R404A has what we call temperature glide - about 7°F where it gradually transitions from liquid to vapor.
This glide is why you'll see both bubble point and dew point data on detailed charts. The bubble point is where the liquid first starts to boil, and the dew point is where the vapor first starts to condense. This 7°F difference between these points affects how you read and apply the chart.
You can find comprehensive pressure data in the official Forane 404A PT chart from Arkema, which includes both bubble and dew point values.
How to Read the R404 Pressure Temperature Chart
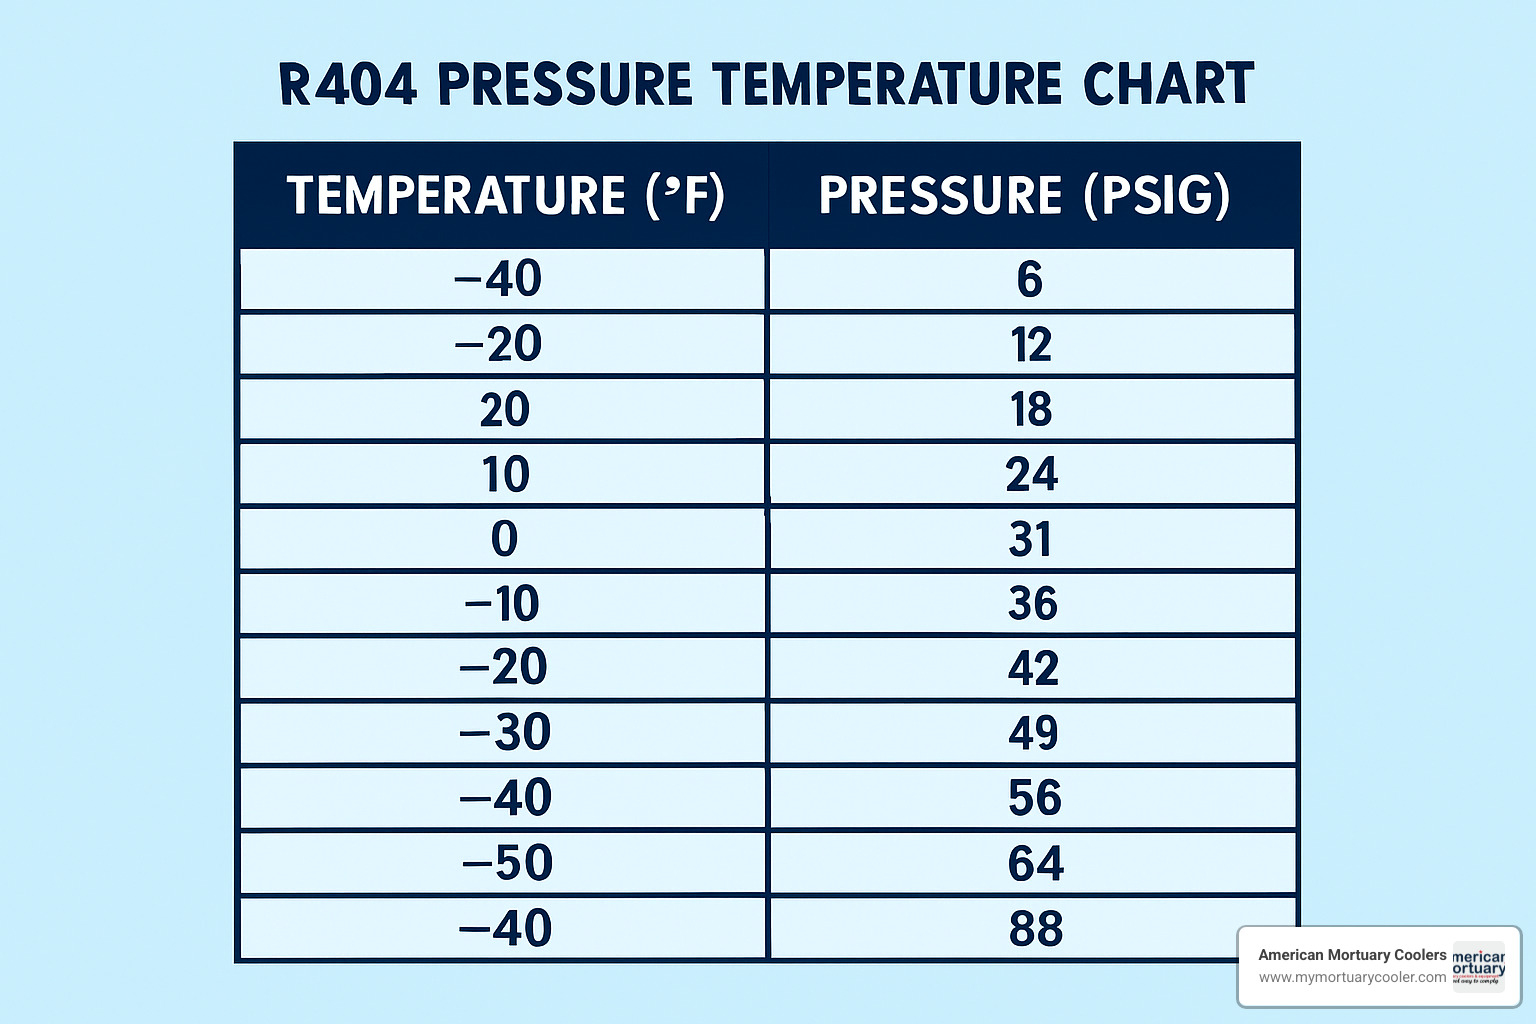
Reading an r404 pressure temperature chart is actually pretty straightforward once you get the hang of it. Let's say you're troubleshooting a mortuary cooler and your low-side gauge reads 124.2 psig. Find that pressure on the chart, and you'll see it corresponds to 60°F saturation temperature.
Going the other direction works too. If you know your evaporator should be running at 20°F, the chart tells you to expect about 55.3 psig on your gauges. When the numbers don't match up, you know something's wrong with the system.
What happens when your gauge reading falls between the chart values? You'll need to interpolate - basically make an educated guess between the two closest numbers. If you measure 50 psig and see that 49 psig equals 15°F while 55.3 psig equals 20°F, your saturation temperature is roughly 16.5°F.
Many techs today skip the manual math and use smartphone apps with built-in r404 pressure temperature chart data. These apps let you punch in either pressure or temperature and instantly get the corresponding value. Pretty handy when you're juggling gauges and trying to diagnose problems.
For more detailed guidance on finding and using these charts, check out our A Practical Guide to Finding a PT Chart for R404A Refrigerant.
Bubble Point vs Dew Point on the R404 Pressure Temperature Chart
This is where that 7°F temperature glide really matters. Bubble point is the temperature where liquid R404A first starts to boil and create vapor bubbles. Dew point is where R404A vapor first starts to condense back into liquid droplets.
For superheat calculations, you want to use the dew point data because you're measuring vapor temperature leaving the evaporator. For subcooling calculations, stick with bubble point data since you're working with liquid refrigerant in the condenser.
Here's a critical point: always charge R404A systems with liquid refrigerant, not vapor. If you charge with vapor, the lighter components enter the system first, which changes the blend composition. This fractionation can mess up system performance and throw off your pressure readings.
Typical R404A Pressures at Key Temperatures
Every tech should have these key pressure points memorized from the r404 pressure temperature chart. At -40°F, you'll see 4.3 psig. At 0°F, expect 32.6 psig. 40°F gives you 85.4 psig, while 80°F jumps up to 173 psig. At 100°F, you're looking at 234.6 psig.
Notice how dramatically the pressure climbs as temperature increases? That's the exponential relationship between temperature and pressure. By the time you hit 150°F, R404A reaches 455.1 psig - getting dangerously close to its critical pressure of 540.8 psi.
This exponential climb explains why hot summer days can cause such headaches with refrigeration systems. A condenser that's struggling to reject heat can quickly build dangerous pressures that trip safety switches or worse.
At American Mortuary Coolers, we've seen this when funeral homes call about their coolers acting up during heat waves. Understanding these pressure relationships helps us diagnose whether it's a refrigerant issue, airflow problem, or just the system working harder against high ambient temperatures.
Applying the Chart in the Field: Charging, Troubleshooting, Maintenance
When applying r404 pressure temperature chart data in real-world situations, you need to account for superheat, subcooling, and system dynamics. The chart gives you saturation values, but operating systems rarely run exactly at saturation conditions.
Superheat is the temperature difference between the actual vapor temperature and the saturation temperature at the same pressure. Subcooling is the temperature difference between the actual liquid temperature and the saturation temperature at the same pressure.
For accurate readings, always ensure your system has been running long enough to reach steady-state conditions. Pressure readings taken immediately after startup or shutdown can be misleading. We recommend waiting at least 15 minutes after any system changes before taking final readings.
Don't forget about altitude corrections. At higher elevations, atmospheric pressure is lower, which affects gauge readings. The r404 pressure temperature chart typically shows gauge pressure (psig), which is pressure above atmospheric. At 5,000 feet elevation, you might see readings that are 2-3 psi lower than expected at sea level.
For more detailed information on R404A pressure applications, see our A Quick Start Guide to R404A Pressure Charts and Values.
Superheat and Subcooling Targets for R404A Systems
Proper superheat and subcooling are critical for R404A system performance. For evaporator superheat, target 4-14°F in most applications. This ensures complete vaporization without excessive heat gain that reduces system efficiency.
Compressor superheat should be maintained at 20°F minimum to prevent liquid slugging. This protects the compressor from damage due to liquid refrigerant entering the cylinders.
For condenser subcooling, target 8-12°F in most systems. This ensures you have liquid refrigerant entering the expansion device and provides some insurance against flash gas formation in the liquid line.
When measuring superheat, use the dew point from your r404 pressure temperature chart. When measuring subcooling, use the bubble point. This accounts for R404A's temperature glide and gives you accurate calculations.
Altitude & Atmospheric Pressure Adjustments
Atmospheric pressure decreases approximately 0.5 psi for every 1,000 feet of elevation gain. Since gauge pressure is measured relative to atmospheric pressure, this affects your readings when using a r404 pressure temperature chart.
At our service locations in higher elevation areas like Denver (5,280 feet), we typically see gauge pressures that are about 2.6 psi lower than the chart values calculated for sea level. This doesn't affect system operation significantly, but it's important to understand when comparing readings to chart values.
For precise work, you can convert gauge pressure to absolute pressure by adding atmospheric pressure, then use absolute pressure charts. However, for most field applications, understanding the general trend is sufficient.
Safety Tips, Regulations & Environmental Impact
R404A carries an ASHRAE safety classification of A1, meaning it's non-flammable and has low toxicity. However, it operates at much higher pressures than many refrigerants, with pressures exceeding 450 psig at high ambient temperatures.
Always wear proper PPE including safety glasses and gloves when working with R404A systems. High-pressure refrigerant can cause serious injury if released unexpectedly. Never exceed the pressure ratings of your gauges or recovery equipment.
From a regulatory standpoint, R404A falls under EPA SNAP regulations and the recent AIM Act. While still legal to use, its high GWP of 3922 means it's being phased down. Recovery and proper disposal are mandatory - never vent R404A to atmosphere.
The EPA's HFC phasedown schedule reduces allowable production and consumption to 15% of baseline levels by 2036. For more information on these regulations, visit the EPA's HFC reduction page.
R404A in Context: Comparisons, Critical Data & Alternatives
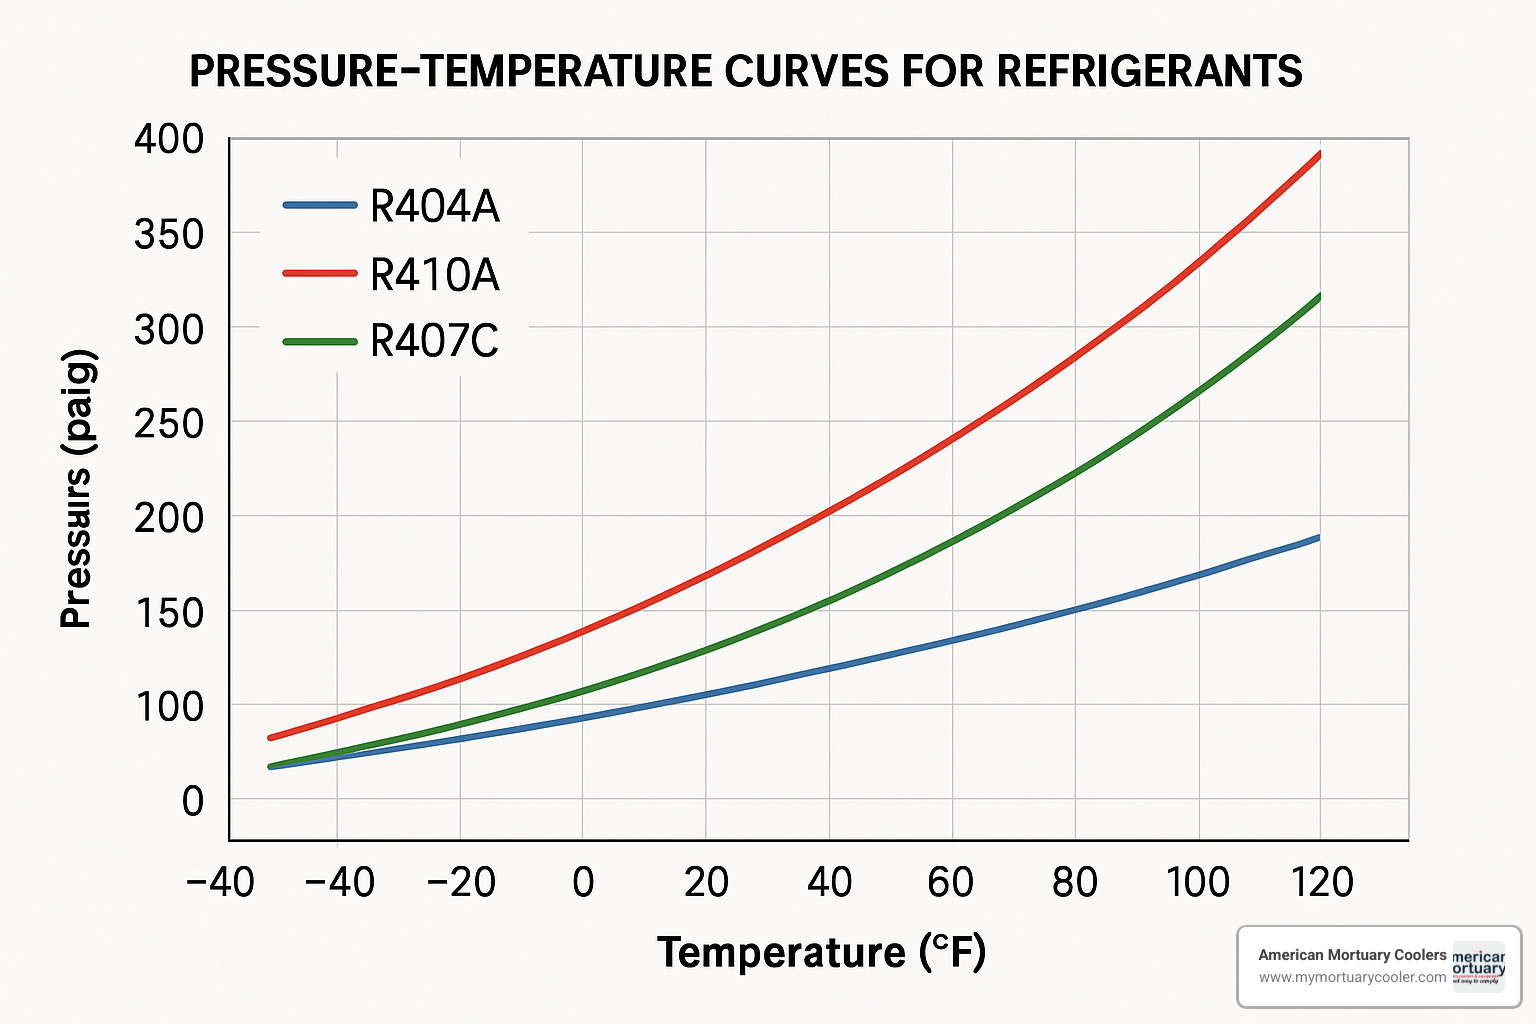
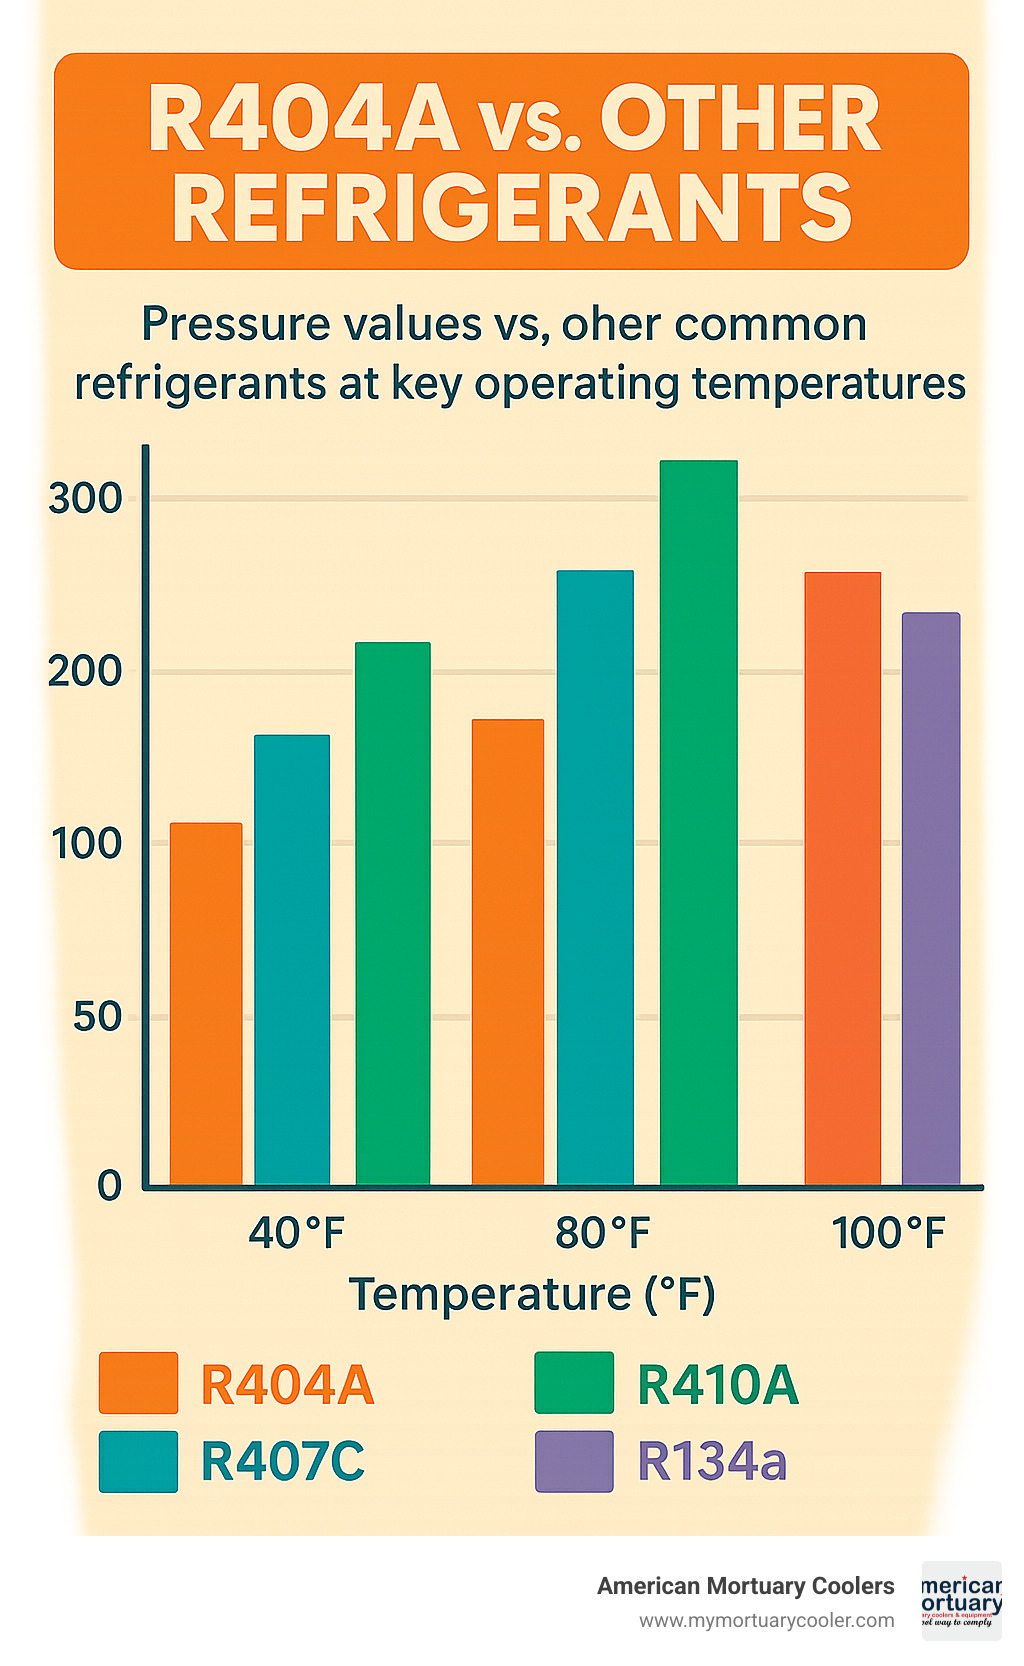
Understanding how R404A compares to other refrigerants helps you make informed decisions about system design and maintenance. R404A typically operates at moderate pressures compared to refrigerants like R410A, which runs at much higher pressures, but higher than R407C.
The critical temperature of 161.7°F and critical pressure of 540.8 psi represent the upper limits of R404A's usefulness. Above the critical temperature, R404A cannot exist as a liquid regardless of pressure. This sets practical limits on condensing temperatures and ambient operating conditions.
For system comparisons and additional refrigerant data, check out this comprehensive Refrigerant Pressure Temperature Chart: R407C, R410a, R134a, R404a resource.
R404A vs R410A & R407C Pressure Differences
R410A operates at significantly higher pressures than R404A. At 100°F, R410A reaches approximately 318 psig compared to R404A's 234.6 psig. This means R410A systems require components rated for higher pressures, but also deliver higher capacity in smaller systems.
R407C operates at lower pressures than R404A, making it easier on system components but less suitable for low-temperature applications. At 40°F, R407C shows approximately 69 psig compared to R404A's 85.4 psig.
When retrofitting systems, these pressure differences matter significantly. Moving from R404A to a higher-pressure refrigerant might require component upgrades, while moving to a lower-pressure refrigerant might allow you to use existing components.
Critical Temperature, Pressure & Glide Considerations
The critical point represents the maximum temperature and pressure at which distinct liquid and vapor phases can exist. For R404A, this occurs at 161.7°F and 540.8 psi. Above these conditions, R404A exists as a supercritical fluid with properties between liquid and vapor.
In practical terms, this means R404A systems can't operate effectively with condensing temperatures much above 140°F. High ambient conditions or dirty condensers that push condensing temperatures toward the critical point will cause severe performance degradation.
The 7°F temperature glide affects system operation in several ways. During evaporation, the refrigerant temperature rises as it vaporizes, which can improve heat transfer in some applications. During condensing, the temperature drops as the refrigerant condenses, which can also improve heat transfer.
For relief valve settings, use pressures corresponding to temperatures well below the critical temperature to ensure proper protection. Many systems use relief valves set at 300-350 psig to provide adequate safety margin.
Frequently Asked Questions about R404 Pressure Temperature Charts
Let's tackle the most common questions we hear from technicians working with r404 pressure temperature charts. These are real-world scenarios you'll encounter when servicing mortuary coolers, walk-in freezers, and other commercial refrigeration equipment.
What is the correct pressure for R404A at 20°F?
Your r404 pressure temperature chart shows R404A at 55.3 psig when the saturation temperature is 20°F. But here's the key point - this is saturation pressure, not necessarily what you'll see on your gauges during normal operation.
Think of it this way: if you're checking suction pressure and want your evaporator running at 20°F, you should see around 55.3 psig plus any pressure drop in your suction line. The actual reading might be 52-53 psig due to line losses, and that's perfectly normal.
On the liquid side, if your liquid temperature is 20°F, you'd expect about 55.3 psig minus whatever subcooling you're running. With 10°F of subcooling, your liquid would actually be at 10°F, giving you a lower pressure reading.
The chart gives you the baseline - your system conditions determine the actual readings you'll see.
How does altitude affect my gauge reading?
Here's something that catches a lot of technicians off guard: altitude changes your gauge readings even though it doesn't affect how your system actually operates. It's all about atmospheric pressure.
Gauge pressure measures pressure above atmospheric pressure. At sea level, atmospheric pressure is 14.7 psi. At higher elevations, atmospheric pressure drops by roughly 0.5 psi per 1,000 feet of elevation.
So if you're working in Denver at 5,280 feet elevation, atmospheric pressure is about 12.1 psi instead of 14.7 psi. Your gauge will read about 2.6 psi lower than what the r404 pressure temperature chart predicts for sea level conditions.
This doesn't mean your system is low on refrigerant - it's just physics. The refrigerant is still at the same absolute pressure, but your gauge shows the difference between refrigerant pressure and the lower atmospheric pressure at altitude.
Can I use the same PT chart for bubble and dew values?
Most basic r404 pressure temperature charts show average saturation values, which work fine for everyday troubleshooting and charging. But when you need precision - especially for superheat and subcooling calculations - you need to account for R404A's temperature glide.
R404A is a blend with a 7°F temperature glide. It doesn't boil or condense at a single temperature like pure refrigerants do. For superheat calculations, you should use dew point values because you're working with vapor leaving the evaporator. For subcooling calculations, use bubble point values because you're dealing with liquid refrigerant.
If your chart doesn't specify bubble and dew points separately, here's a practical workaround: subtract 3.5°F from the chart temperature for dew point, add 3.5°F for bubble point. This splits the 7°F glide evenly and gets you close enough for most field applications.
For critical applications like our custom mortuary coolers where temperature precision matters, we recommend getting comprehensive charts that show both bubble and dew point data. It's worth the extra accuracy when you're protecting valuable specimens or maintaining the precise conditions funeral homes depend on.
Conclusion
Working with the r404 pressure temperature chart doesn't have to be complicated. Once you understand the basics - that R404A has a predictable pressure-temperature relationship, that it's a blend with temperature glide, and that you need to account for superheat and subcooling - everything else falls into place.
At American Mortuary Coolers, we've been helping funeral homes maintain their refrigeration systems for years. Based right here in Tennessee, we've seen how proper r404 pressure temperature chart knowledge makes the difference between a system that runs reliably and one that breaks down when you need it most.
Our mortuary coolers are built to last, and we deliver them directly to funeral homes across all 48 contiguous states. But even the best equipment needs proper maintenance, and that's where understanding pressure-temperature relationships becomes crucial. Whether you're in our Johnson City headquarters or servicing equipment in California, the science stays the same.
R404A isn't going anywhere overnight. Yes, the AIM Act is pushing the industry toward lower-GWP refrigerants, but thousands of existing systems will keep running for years to come. Knowing how to read the r404 pressure temperature chart keeps these systems operating efficiently while the industry transitions.
The key takeaways are simple: memorize the common pressure points, understand the difference between bubble and dew points for blend refrigerants, and always account for superheat and subcooling in your calculations. Safety comes first - R404A operates at high pressures, so proper PPE and recovery procedures aren't optional.
For technicians who want to dig deeper into advanced applications and troubleshooting scenarios, our The Ultimate Guide to 404A P-T Charts: Pressure Temperature Reference covers everything from altitude corrections to retrofit considerations.
Every funeral home deserves refrigeration equipment that works when they need it. With the knowledge from this guide, you can ensure R404A systems maintain the precise temperature control that mortuary applications demand. The r404 pressure temperature chart is your roadmap - use it confidently, and your systems will reward you with years of reliable service.


