Why the R404A PT Chart is Essential for Mortuary Cooler Operations
The r404a pt chart is a critical reference tool that shows the precise pressure-temperature relationship for R404A refrigerant across all operating conditions. Whether you're troubleshooting a walk-in cooler or charging a new system, this chart tells you exactly what pressure to expect at any given temperature.
Quick R404A PT Chart Reference:
- 0°F = 32.6 psig (typical freezer evaporator)
- 40°F = 85.4 psig (typical cooler evaporator)
- 100°F = 234.6 psig (typical condenser temperature)
- Critical point: 161.7°F at 540.8 psi (maximum safe operating limit)
R404A is a blend of three HFC refrigerants (44% R125, 4% R134a, 52% R143a) with a Global Warming Potential of 3,922. It's widely used in low and medium-temperature commercial refrigeration including mortuary coolers, walk-in freezers, and display cases.
The PT chart becomes essential when you need to:
- Calculate superheat and subcooling values
- Diagnose system problems through pressure readings
- Properly charge refrigeration systems
- Set pressure controls and safety devices
"One of the very first steps when diagnosing any refrigeration system is understanding the temperature and pressure at which your system is operating" - a fundamental principle that makes the R404A PT chart indispensable for field technicians.
I'm Mortuary Cooler, a national-level mortuary cooler supplier with experience in commercial refrigeration systems. Throughout my years working with funeral homes and mortuary facilities, I've seen how critical it is for operators to understand the r404a pt chart for maintaining reliable cooling systems that protect their most sensitive operations.
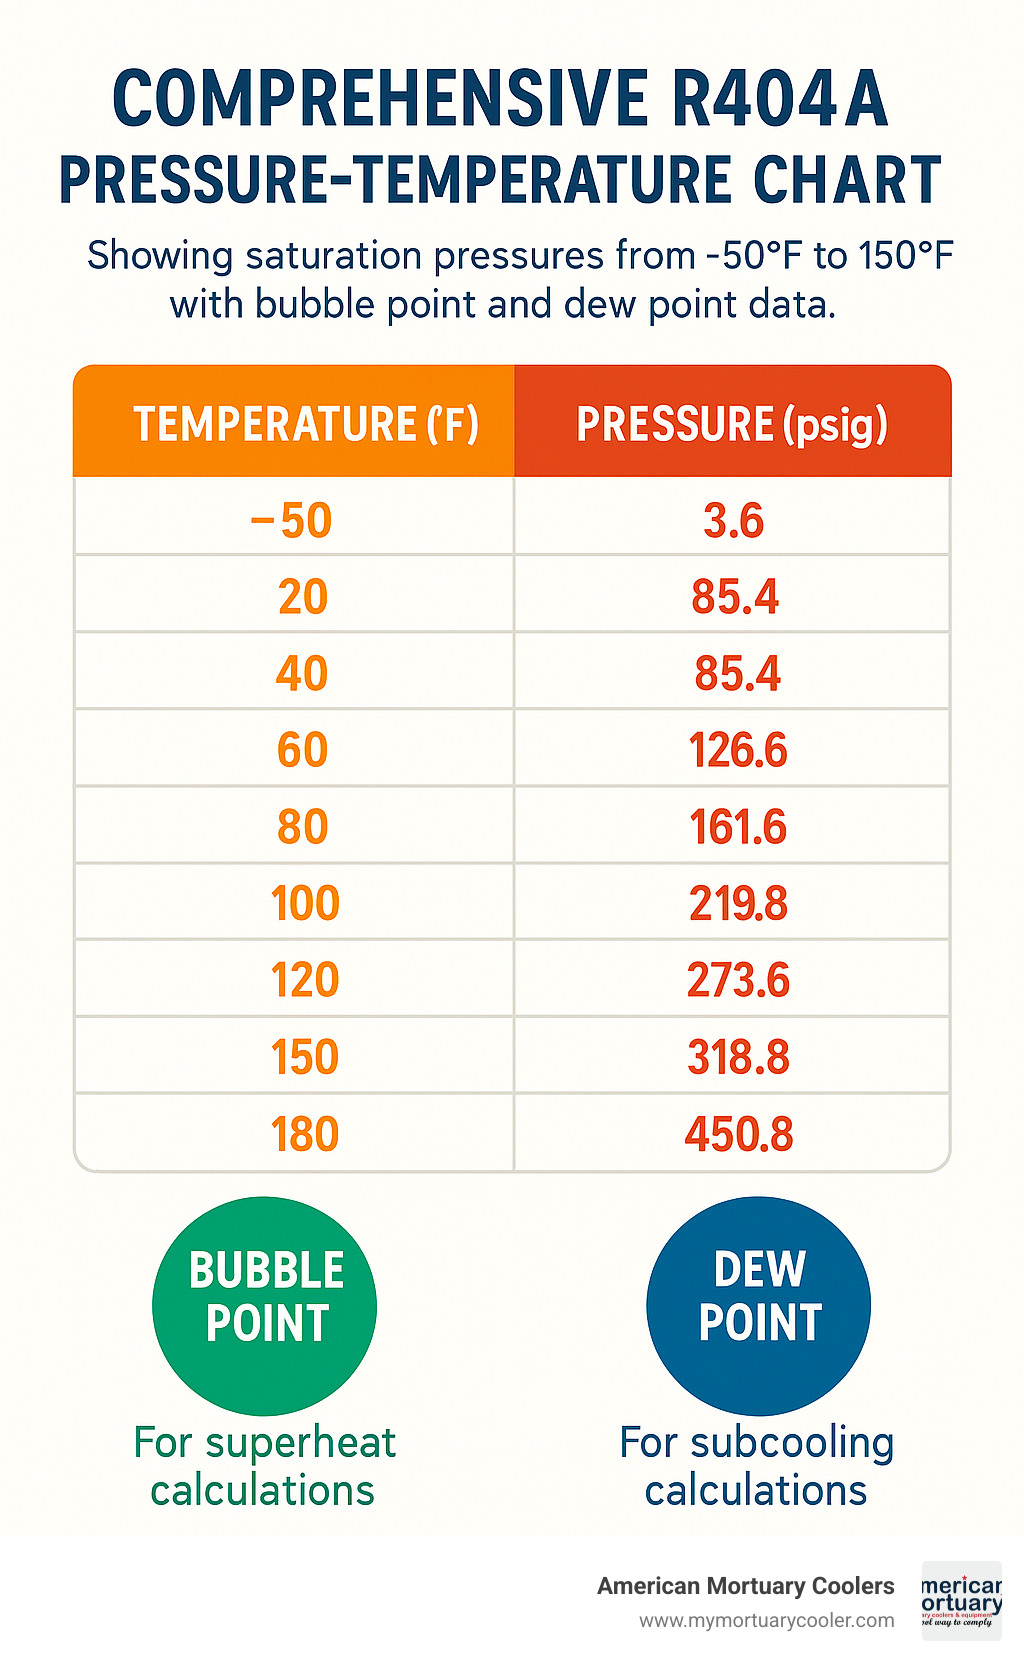
Know your r404a pt chart terms:
R404A Fundamentals: Composition, Uses & Safety
Understanding R404A starts with knowing what you're actually working with. This ternary blend combines three different HFC refrigerants in precise proportions: 44% R125, 4% R134a, and 52% R143a. Think of it like a carefully crafted recipe - each ingredient brings specific properties that make the final blend perfect for low and medium-temperature refrigeration.
When R404A was developed, engineers needed a direct replacement for the older R22 and R502 refrigerants that were being phased out. They succeeded brilliantly. With a molecular weight of 97.6 g/mol and a boiling point of -51.88°F at atmospheric pressure, R404A became the go-to choice for commercial refrigeration systems.
The refrigerant earns an ASHRAE safety classification of A1, which is the best rating you can get. This means it's non-toxic and non-flammable under normal operating conditions - a huge relief when you're working in enclosed spaces like mortuary facilities.
But here's where things get complicated. R404A has a Global Warming Potential (GWP) of 3,922, which puts it firmly in the environmental hot seat. The EPA's AIM Act is systematically reducing HFC production allowances, dropping them to just 15% of baseline by 2036. This phase-down context means R404A is becoming both scarcer and more expensive every year.
At American Mortuary Coolers, we've relied on R404A for years because it simply works. In mortuary applications where consistent temperatures are absolutely critical, this refrigerant delivers reliable performance. One key requirement is using POE (polyolester) oils - these synthetic lubricants are mandatory with HFC blends because they handle moisture better and stay compatible with the refrigerant chemistry.
Safety should always be your first priority when handling R404A. Always wear proper PPE including safety glasses and gloves when working with the refrigerant. Ensure adequate ventilation in enclosed spaces, since even non-toxic refrigerants can displace oxygen in high concentrations. Never expose cylinders to temperatures above 125°F - the pressure buildup can be dangerous. Use leak detectors specifically rated for HFC refrigerants, and always follow proper recovery and recycling procedures to stay compliant with environmental regulations.
Key Applications in the Field
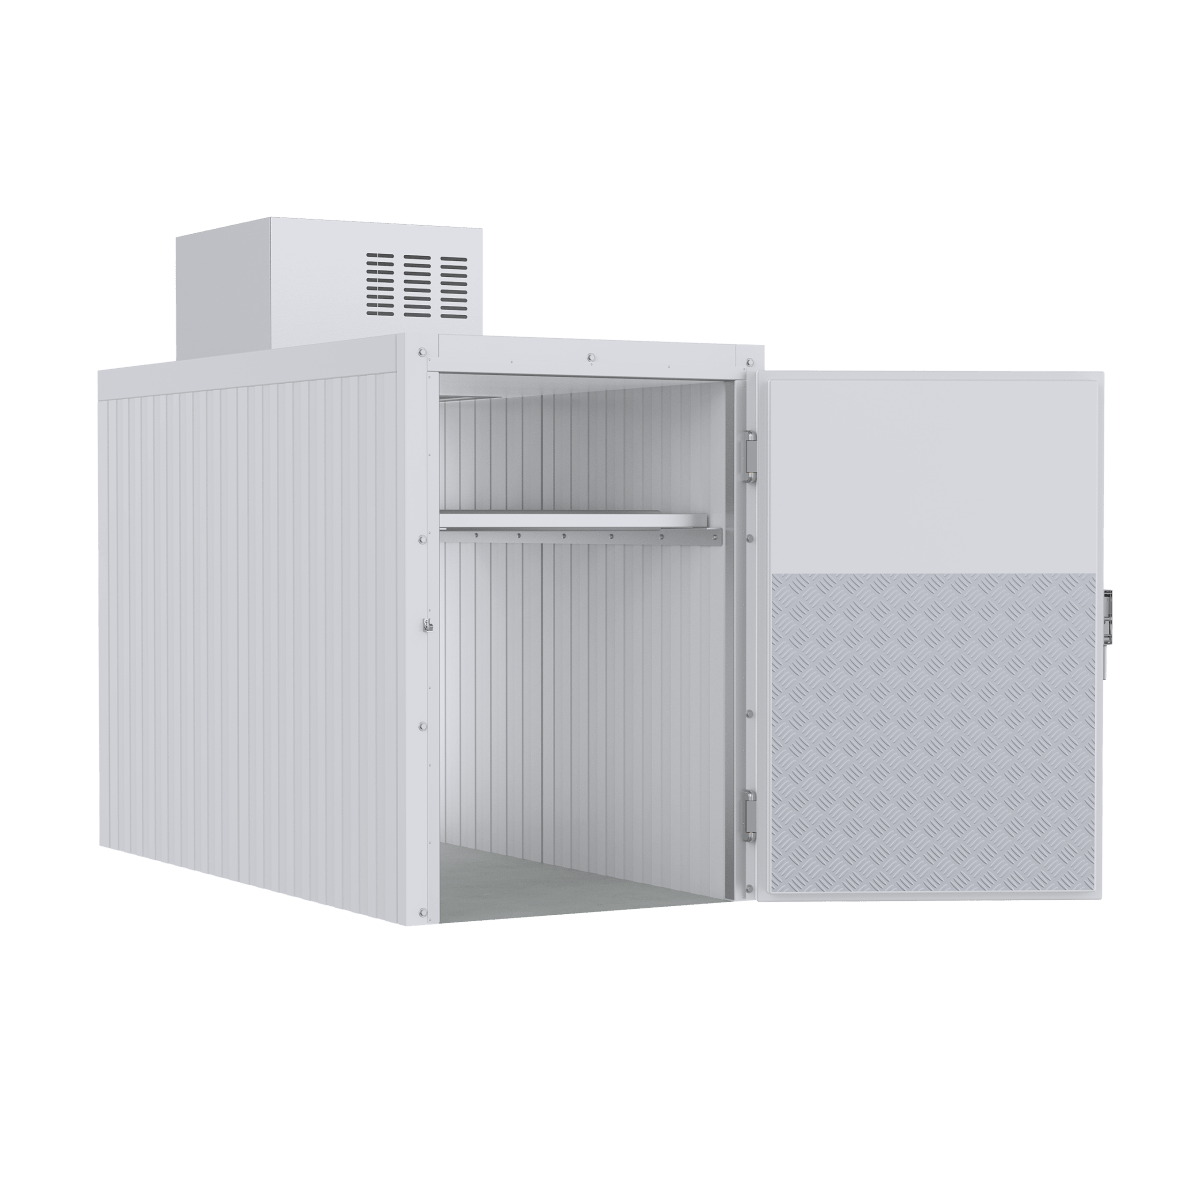
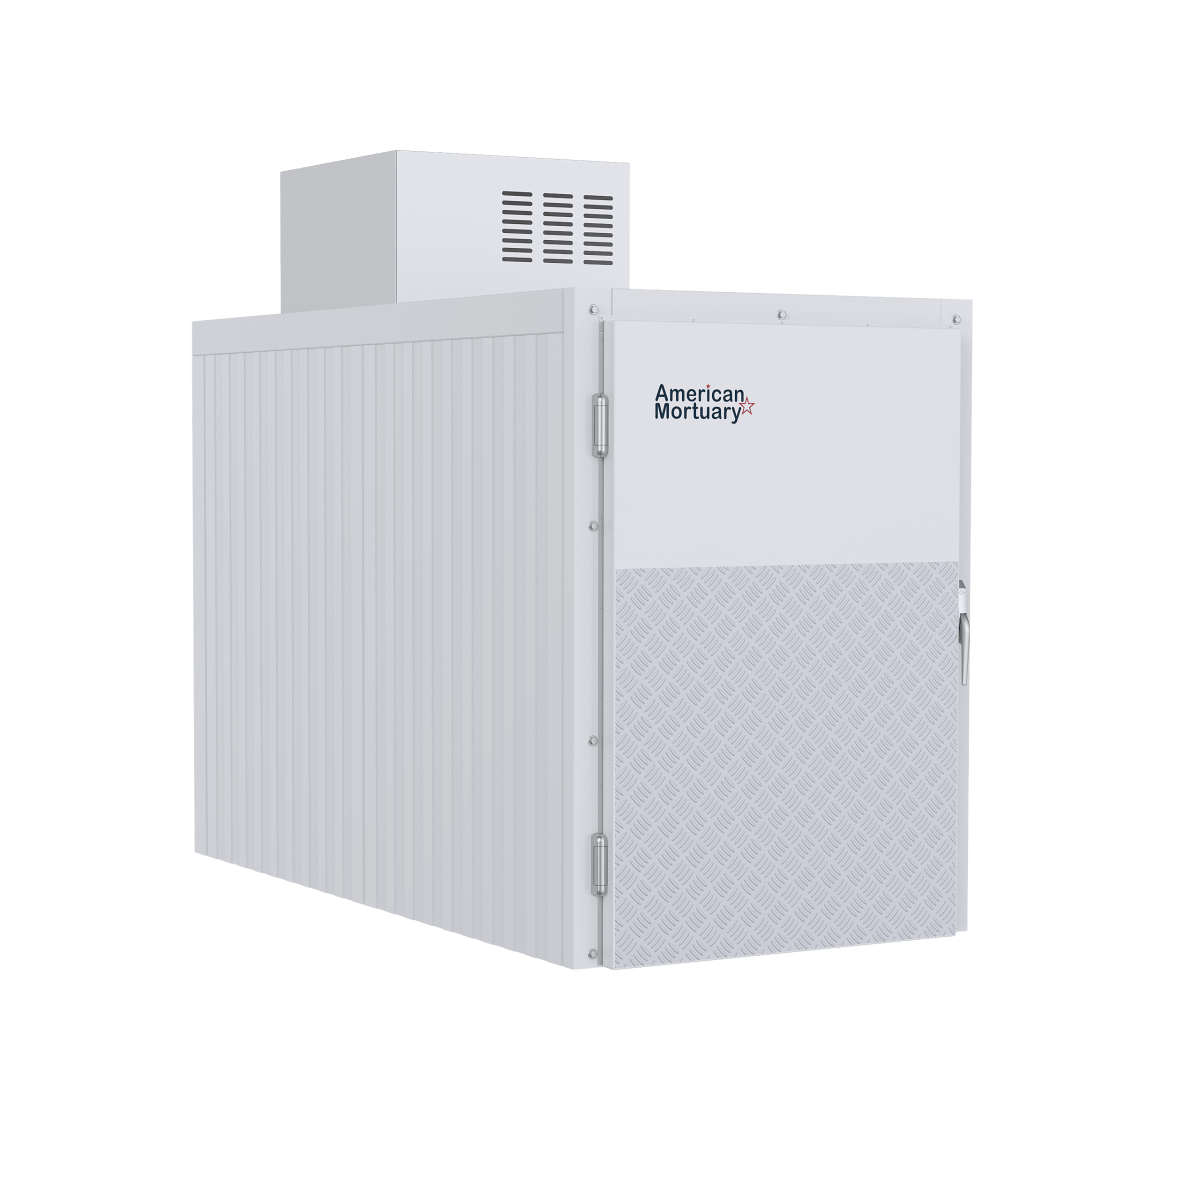
R404A dominates several key sectors where reliable refrigeration makes the difference between success and disaster. In mortuary facilities, we use it extensively in walk-in coolers where bodies are stored at the critical 35-38°F range. The refrigerant also powers blast freezers operating at -10 to -30°F, transport refrigeration units (reefers) that maintain cold chain integrity during shipping, and ice cream display cases in retail environments.
From our Tennessee headquarters, we've installed R404A systems across the country - from humid Florida funeral homes to desert facilities in Nevada. The refrigerant's excellent heat transfer properties and wide operating range make it ideal for the demanding requirements of funeral home refrigeration.
Supermarket freezers represent another major application area. These systems run 24/7 under varying load conditions, and R404A handles the challenge beautifully. The refrigerant maintains consistent temperatures even when customers frequently open freezer doors or when ambient temperatures fluctuate.
More info about walk-in compressors can help you understand how R404A integrates with different compressor technologies and why proper matching is so important for system efficiency.
Critical Temperature & Pressure Specs
Every refrigerant has limits, and knowing R404A's boundaries keeps you safe and your systems running. The critical temperature is 161.7°F (72°C) with a critical pressure of 540.8 psi. Beyond these points, something interesting happens - R404A can't exist as separate liquid and vapor phases anymore. It becomes what's called a supercritical fluid.
In real-world applications, you'll rarely approach these critical limits. But they're crucial for understanding design limits and setting up safety systems. Relief valves are typically rated between 375-450 psid for scroll compressors, giving you a safety margin before reaching dangerous pressures.
Component rating becomes especially important in hot climates. At 150°F, R404A reaches 455.1 psig - uncomfortably close to relief valve settings. This is why we always emphasize proper condenser maintenance and airflow when we install systems in places like Arizona or Texas.
The critical specs also determine maximum safe storage temperatures for refrigerant cylinders and help calculate safety factors for pressure vessel design. Understanding why condenser performance drops dramatically above 140°F becomes clear when you see how close you're getting to those critical limits on the r404a pt chart.
Decoding the R404A PT Chart
Understanding your r404a pt chart is like having a roadmap for refrigeration troubleshooting. At American Mortuary Coolers, we've seen countless service calls that could have been avoided if technicians knew how to read these charts properly.
The r404a pt chart shows saturation pressure-temperature data in a format that's standardized across the industry. Most reputable charts pull their data from the NIST REFPROP Standard Reference Database - the gold standard for refrigerant properties. This means whether you're working in Tennessee or California, you're using the same reliable data.
What you'll see on any quality R404A chart is temperature listed in both Fahrenheit and Celsius, with matching pressures shown in psig (pounds per square inch gauge). The chart typically covers everything from -50°F up to 150°F, which handles pretty much every situation you'll encounter in the field.
Here's what makes R404A charts different from simpler refrigerants: you'll notice both liquid and vapor pressure columns. That's because R404A is a blend of three different refrigerants, not a pure substance. It has what we call a temperature glide of about 0.7°F - meaning it doesn't change phase at exactly one temperature like pure refrigerants do.
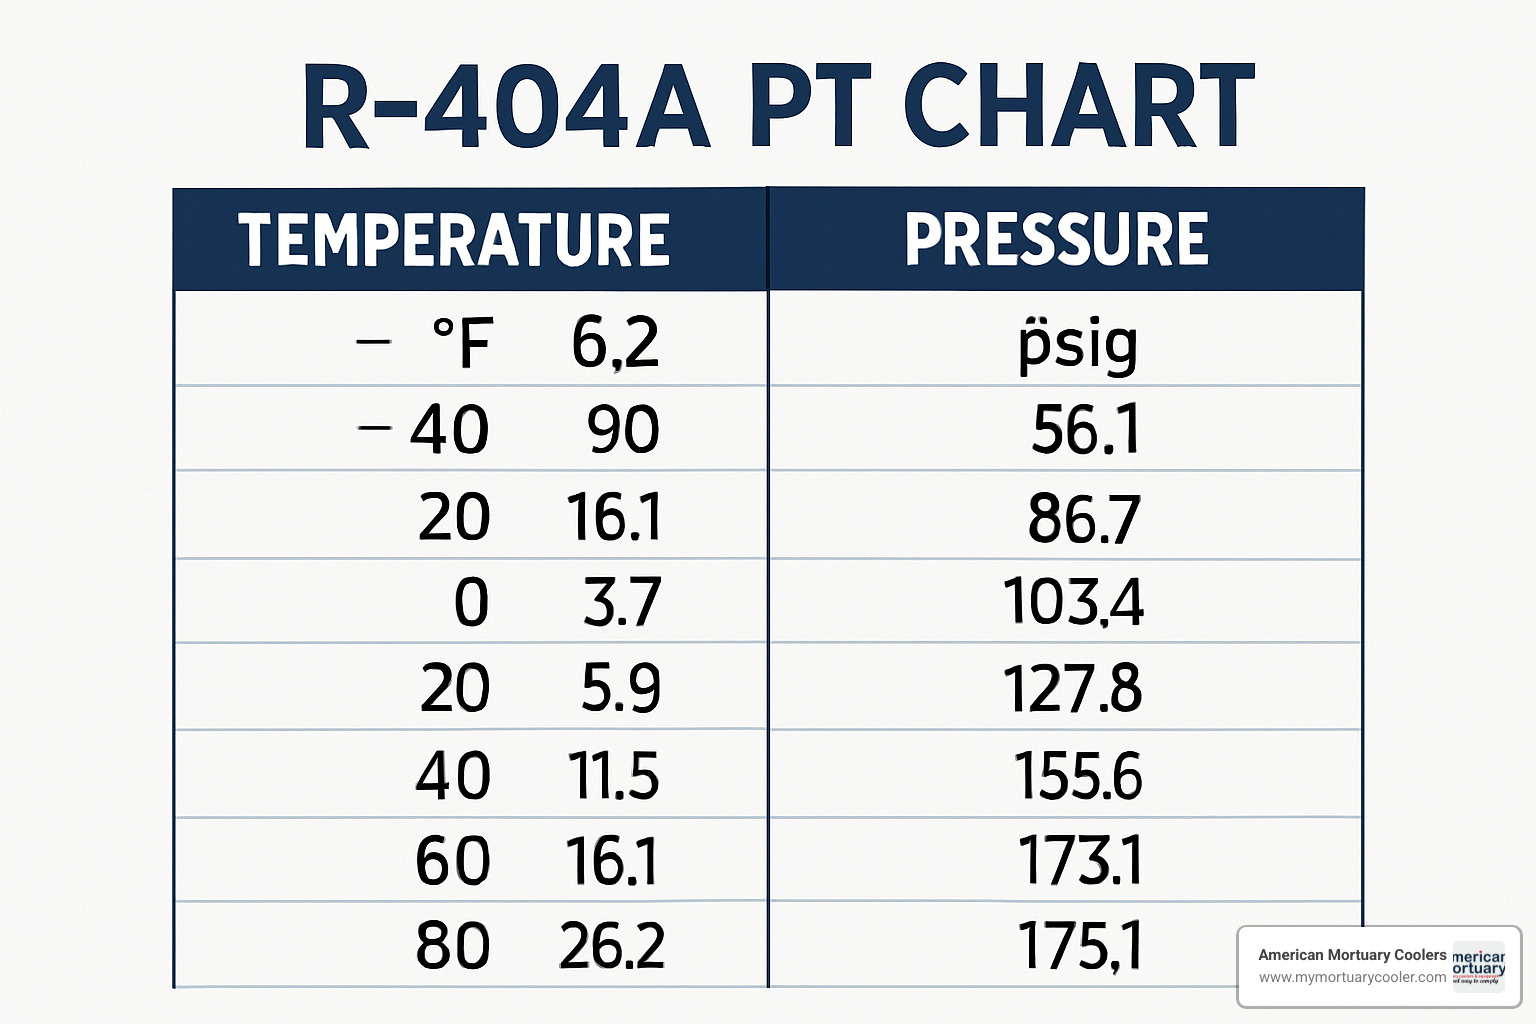
What Is a PT Chart and Why Does R404A Need One?
Think of a pressure-temperature chart as the DNA profile for your refrigerant. It maps out exactly what pressure R404A will be at any given temperature when it's changing from liquid to vapor (or vice versa). This relationship is what makes refrigeration possible in the first place.
For R404A specifically, having an accurate r404a pt chart isn't optional - it's essential. Unlike pure refrigerants that follow predictable patterns, this blend has its own personality. The relationship between pressure and temperature isn't perfectly linear, which means you can't just guess or rely on rules of thumb.
We use PT charts for system charging because they tell us exactly what pressures to expect at known temperatures. When diagnosing problems, the chart helps us spot when pressures are too high or too low for the conditions we're seeing. And for regulatory compliance, many jurisdictions require documented pressure-temperature records for commercial refrigeration systems.
In our mortuary cooler installations, precision matters. A body storage unit that's running too warm because someone guessed at the refrigerant charge isn't just inefficient - it's a serious problem for our customers. The PT chart takes the guesswork out of the equation.
Reading the R404A PT Chart Step-by-Step
Here's how we train our technicians to use the r404a pt chart effectively in the field:
Start by identifying what you're measuring. Are you looking at suction pressure from the evaporator? Discharge pressure from the compressor? Or liquid line pressure? Each measurement point tells you something different about system performance.
Next, verify your gauge accuracy. We've seen too many wild goose chases caused by inaccurate manifold gauges. Make sure your equipment is calibrated and rated for R404A's pressure range.
Account for ambient conditions when taking readings. Extreme heat or cold affects both your gauges and the system performance. What looks like a problem might just be normal operation under unusual conditions.
Find your measured pressure on the appropriate column of the chart - liquid column for liquid line measurements, vapor column for suction line readings. Then read across to find the saturation temperature. This tells you what temperature the refrigerant should be at that pressure.
Finally, compare saturation temperature to actual temperature to calculate superheat or subcooling. This is where the real diagnostic magic happens.
For pressures that fall between the listed values, simple interpolation works fine. If you measure 60 psig and the chart shows 50 psig at 25°F and 70 psig at 35°F, you're looking at about 30°F saturation temperature.
Scientific research on R404A saturation data provides even more detailed tables when you need precise calculations for critical applications.
Bubble Point vs Dew Point on the r404a pt chart
This is where R404A shows its true colors as a refrigerant blend. Unlike pure refrigerants that change phase at a single temperature, R404A has what we call temperature glide - it changes phase over a small temperature range.
Bubble point is the temperature where liquid R404A starts to boil - where the first vapor bubble appears. When you're calculating subcooling, use bubble point pressures because you're working with liquid refrigerant in the liquid line.
Dew point is the temperature where R404A vapor starts to condense - where the first liquid droplet forms. For superheat calculations, use dew point pressures since you're dealing with vapor refrigerant in the suction line.
The difference between these two points is typically 0.7°F for R404A - small enough that some technicians ignore it, but significant enough to matter in precision work. In our mortuary applications where temperature control is absolutely critical, we always use the correct point for our calculations.
One thing to watch out for is fractionation. If a system has had large leaks over time, the lighter components of the R404A blend might leak out faster than the heavier ones. This changes the blend composition and throws off your pressure-temperature relationship. That's why we always recommend recovering the entire charge and starting fresh rather than trying to top off systems with significant leak history.
The small temperature glide actually helps R404A's heat transfer efficiency in many applications, but it does mean you need to pay attention to which column of the r404a pt chart you're using for your calculations.
Using the Chart for Superheat, Subcooling & Troubleshooting
The r404a pt chart transforms from a simple reference tool into your diagnostic crystal ball when you master superheat and subcooling calculations. These two measurements reveal the hidden story of what's really happening inside your refrigeration system.
Think of superheat as your insurance policy against compressor damage. It measures how much hotter the refrigerant vapor is compared to its saturation temperature. When superheat runs between 6-12°F for R404A systems, you know liquid refrigerant won't flood back and destroy your compressor. Too little superheat? You're flirting with disaster. Too much? Your evaporator isn't doing its job efficiently.
Subcooling tells you whether your condenser is pulling its weight. It measures how much cooler the liquid refrigerant is compared to its saturation temperature. Proper subcooling of 8-15°F for R404A means you've got solid liquid entering your expansion device, maximizing system capacity and preventing flash gas problems.
After servicing mortuary coolers across the country, I've learned that 90% of refrigeration headaches show up first as wonky superheat or subcooling values. The r404a pt chart becomes your roadmap to figuring out whether you're dealing with a simple charge issue or something more serious.
When mortuary coolers start acting up, time is critical. Funeral homes can't afford equipment failures during services. That's why understanding these calculations can save the day. More info about iced evaporators shows how improper superheat often creates ice buildup that shuts down systems at the worst possible moments.
Superheat Calculation Walk-Through
Let me walk you through the superheat calculation that's saved countless compressors from premature death. The process is straightforward once you get the hang of it.
First, measure your suction line temperature using a quality thermometer clamped to the suction line near the compressor. Make sure you insulate the thermometer from ambient air - you want the actual refrigerant temperature, not what the warehouse feels like.
Next, read your suction pressure from the low-side gauge on your manifold set. Double-check that your gauges are calibrated and reading accurately.
Now comes the r404a pt chart magic. Look up your suction pressure in the vapor column (dew point) to find the saturation temperature. We use dew point for superheat because we're dealing with vapor refrigerant.
Finally, calculate superheat by subtracting the saturation temperature from your actual suction line temperature.
Here's a real-world example from a recent service call: Suction pressure read 25 psig, and the suction line temperature measured 15°F. Looking at the r404a pt chart, 25 psig vapor equals 5°F saturation temperature. So superheat = 15°F - 5°F = 10°F superheat - right in the sweet spot for R404A systems.
When superheat runs high, you're usually looking at an undercharged system or restricted airflow across the evaporator. Low superheat typically means overcharge or expansion valve problems that need immediate attention.
Subcooling Calculation Walk-Through
Subcooling calculation follows the same logical approach but focuses on the high-side of your system. This measurement tells you whether your condenser is rejecting heat properly.
Start by measuring the liquid line temperature with your thermometer clamped to the liquid line leaving the condenser. Again, insulate from ambient conditions for accurate readings.
Read your discharge pressure from the high-side gauge. If you have a liquid line service port, that pressure reading works even better for subcooling calculations.
Here's where the r404a pt chart comes in again. Look up your pressure in the liquid column (bubble point) to find the saturation temperature. We use bubble point for subcooling because we're working with liquid refrigerant.
Calculate subcooling by subtracting the actual liquid line temperature from the saturation temperature.
From another recent job: Discharge pressure showed 200 psig with a liquid line temperature of 85°F. The r404a pt chart shows 200 psig liquid equals 95°F saturation temperature. So subcooling = 95°F - 85°F = 10°F subcooling - perfectly acceptable for most R404A applications.
Low subcooling usually points to undercharge or condenser problems. Excessive subcooling often means overcharge or poor condenser airflow that needs addressing.
Common Field Diagnostics with the PT Chart
After years of troubleshooting refrigeration systems, certain patterns emerge that make the r404a pt chart your best diagnostic friend. These combinations of symptoms tell the real story of what's happening inside your system.
When you see low suction pressure combined with high superheat, you're almost certainly looking at an undercharged system - the most common problem we encounter. Sometimes it's a restricted liquid line or clogged filter drier, but start with checking the charge. Occasionally, the expansion valve is undersized or restricted, or the evaporator isn't getting enough airflow.
High suction pressure with low superheat typically screams overcharge, though it could also indicate an oversized or stuck-open expansion valve. Sometimes the compressor is losing efficiency, or you've got non-condensables contaminating the system.
High head pressure with low subcooling usually means your condenser needs attention. Check for dirty coils, restricted airflow, or condenser fan problems. In hot climates, ambient temperatures might be pushing your system beyond its design limits.
Normal pressures but temperature control issues often point to problems outside the refrigeration cycle itself. Look at thermostat operation, defrost cycles, door seals, or insulation problems.
Don't forget about elevation effects when interpreting your readings. For every 1,000 feet above sea level, atmospheric pressure drops about 0.5 psi, which shifts all your gauge readings. We account for this when servicing facilities in Denver, Salt Lake City, and other high-altitude locations where the thin air affects everything.
Scientific research on PT troubleshooting provides additional diagnostic scenarios that can help with more complex problems you might encounter in the field.
R404A PT Chart Values & Altitude Corrections
Every refrigeration technician needs certain r404a pt chart values burned into memory. These pressure-temperature relationships form the foundation of field diagnostics and system commissioning. At American Mortuary Coolers, we've trained our service team to recognize these critical benchmarks instantly.
The standard r404a pt chart assumes you're working at sea level with 14.7 psia atmospheric pressure. In the real world, we service facilities from sea-level locations in Florida to mountain towns in Colorado, so understanding altitude corrections becomes essential.
Here's what separates experienced technicians from newcomers: knowing that 0°F equals 32.6 psig, 40°F equals 85.4 psig, and 100°F equals 234.6 psig. These three numbers will get you through most troubleshooting scenarios. When we're commissioning a new mortuary cooler, these are the first pressures we verify.
The full temperature range extends from -50°F at 0.1 psig for deep freeze applications up to 150°F at 455.1 psig where you're approaching dangerous relief valve territory. At the extreme cold end, charts show vacuum readings in inches of mercury since the pressure drops below atmospheric.
What makes R404A tricky is how quickly pressures climb at higher temperatures. The jump from 100°F to 120°F takes you from 234.6 psig to 270.4 psig - a 36 psi increase that can catch inexperienced technicians off guard.
Sea-Level Quick-Reference Points
Three pressure points handle most field situations you'll encounter. We've built our training program around these because they cover the essential operating ranges for mortuary refrigeration.
0°F equals 32.6 psig - this is your freezer sweet spot. When we're setting up mortuary freezers for long-term storage, this pressure tells us everything about system performance. If you're way off this number at 0°F, something's seriously wrong with your system.
40°F equals 85.4 psig - the workhorse pressure for mortuary coolers. Bodies get stored at 35-38°F, making this pressure point absolutely critical for our applications. We probably reference this number more than any other during service calls.
100°F equals 234.6 psig - your standard condenser operating pressure in moderate climates. When the weather hits 95°F outside, expect condenser temperatures around 100-105°F. This pressure point helps you quickly assess whether condenser performance is normal.
These three numbers eliminate the need to constantly flip through charts during routine service. You can spot problems immediately when pressures deviate significantly from these benchmarks. It's the difference between looking professional and fumbling around with paperwork while your customer watches.
Adjusting for High-Altitude Locations
Altitude throws a wrench into standard r404a pt chart readings. Every 1,000 feet of elevation drops atmospheric pressure by roughly 0.5 psi, which affects both your gauge readings and actual system performance.
The math is straightforward: take your elevation in feet, divide by 1,000, then multiply by 0.5. Add this correction to your gauge reading when consulting the chart. So if you're servicing a facility in Denver at 5,000 feet, add 2.5 psi to whatever your gauges show.
We've installed mortuary coolers in ski resort towns above 8,000 feet elevation. At that altitude, you're looking at 4+ psi corrections, and the thin air creates additional challenges. Condensers work more efficiently because of lower ambient pressure, but compressors lose capacity due to reduced suction density.
The real headache comes with expansion valve sizing and fan selection. What works perfectly at sea level can leave you with poor performance in the mountains. We've learned to specify different components for high-altitude installations, especially when facilities are above 3,000 feet.
Relief valve settings don't change with altitude since they operate on absolute pressure. However, your system's ability to reject heat changes dramatically, which can push operating pressures higher than expected on hot days.
Critical Limits and Safe Handling
R404A becomes dangerous fast when temperatures climb. At 150°F, you hit 455.1 psig - dangerously close to relief valve settings that typically run 450-500 psig. We've seen systems pop relief valves when left in hot trucks during summer deliveries across the Southwest.
The critical temperature of 161.7°F at 540.8 psi represents the absolute maximum. Beyond this point, R404A can't exist as separate liquid and vapor phases. You never want to approach these limits in real-world applications.
Safe handling becomes critical when ambient temperatures soar. Never store cylinders above 125°F, and always transport them in ventilated vehicles. We learned this lesson the hard way during a Phoenix installation where cylinder temperatures exceeded safe limits in a closed truck.
System design requires adequate safety margins. Install high-pressure cutouts well below relief valve settings, and size relief valves at least 25% above maximum expected pressures. Scroll compressors typically have internal relief valves set at 375-450 psid, which provides the first line of protection.
The key is understanding that R404A pressures climb exponentially, not linearly. The difference between a hot day and a dangerous situation can be just 20-30°F in condenser temperature. That's why proper condenser maintenance and adequate airflow matter so much in our mortuary cooler applications.
Comparing R404A to Alternative Refrigerants
The refrigeration landscape is changing fast, and R404A's days are numbered. With a GWP of 3,922, this workhorse refrigerant faces serious regulatory pressure under the EPA's AIM Act. At American Mortuary Coolers, we're helping funeral homes across the country steer these changes while keeping their cooling systems running reliably.
Understanding your alternatives starts with knowing how R404A stacks up against other refrigerants in real-world applications.
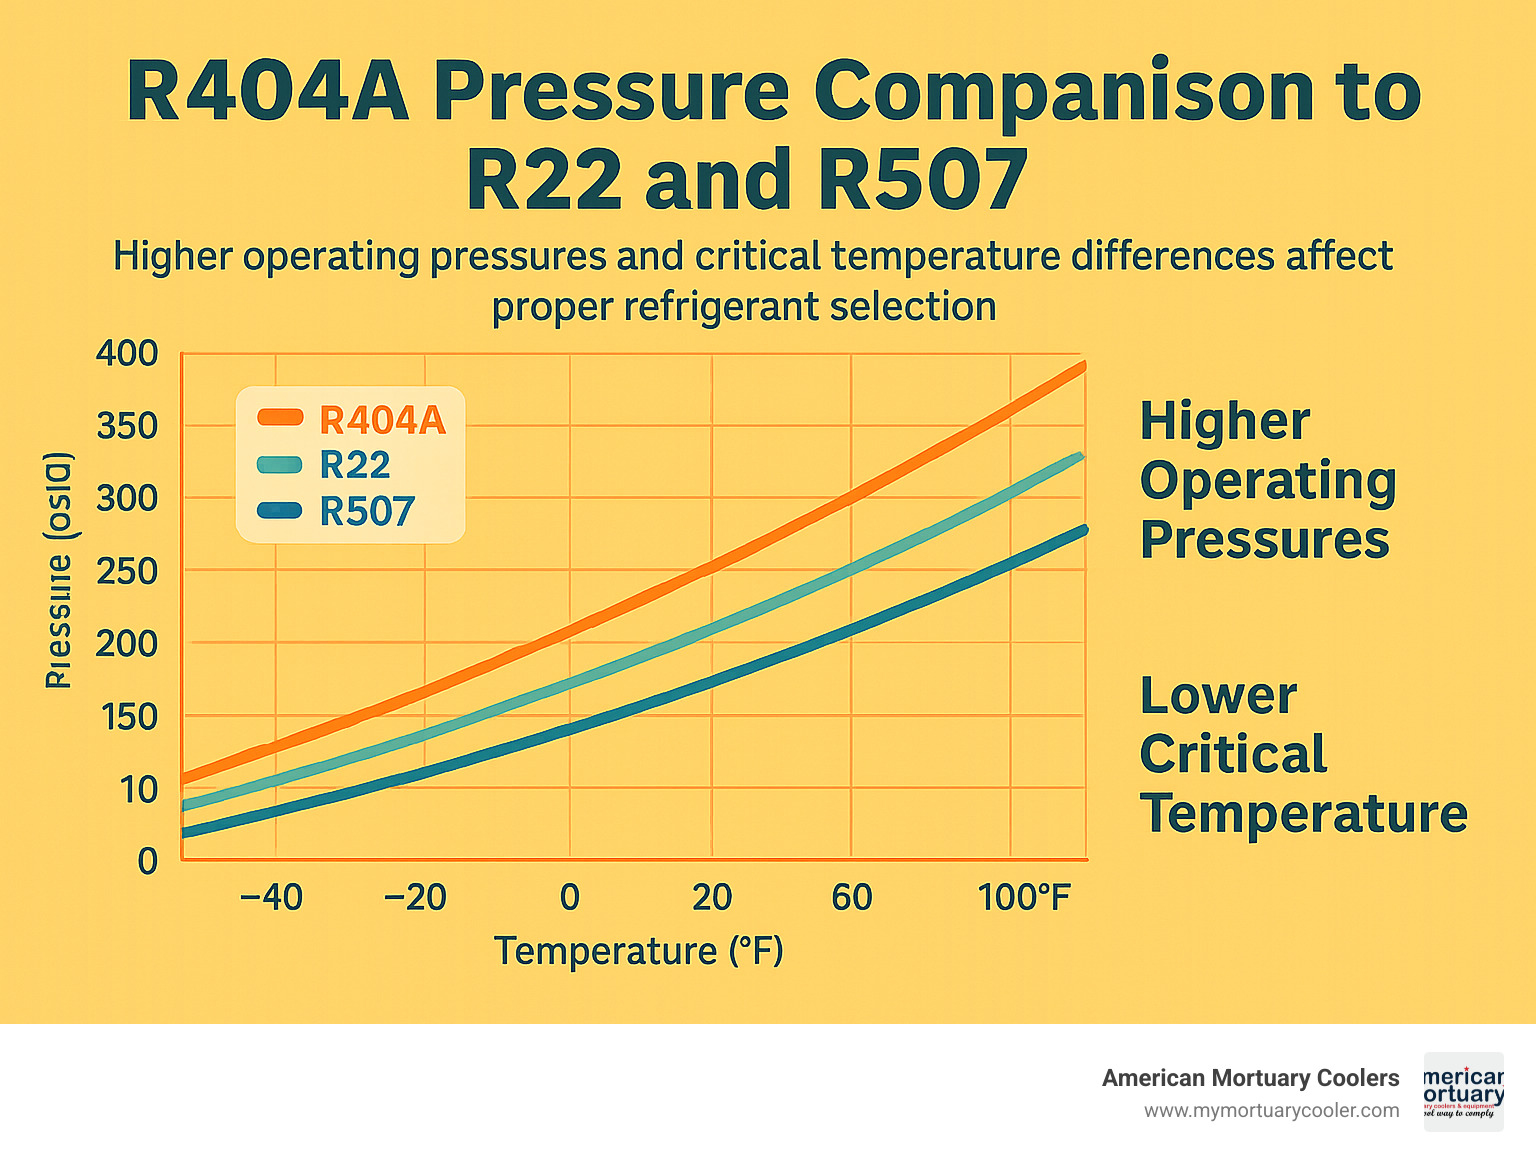
R404A versus R22 tells an interesting story. The older R22 runs at much lower pressures - just 157 psig at 100°F compared to R404A's hefty 235 psig. But R22's ozone depletion potential of 0.055 got it banned years ago. R404A was actually designed as R22's replacement for freezer work, and it delivers better capacity and efficiency in those low-temperature applications we see in mortuary coolers.
The R404A versus R134a comparison shows why refrigerant selection matters so much. R134a has a much friendlier GWP of 1,430 and operates at lower pressures, making it easier on system components. But it simply can't handle the heavy lifting required for freezer applications below 20°F. We use R134a in some medium-temperature mortuary applications, but it's not suitable for the deep cooling that funeral homes often need.
R404A versus R507 is almost like comparing twins. These two refrigerants have nearly identical performance characteristics and pressure-temperature relationships. Unfortunately, they also share the same regulatory problems - R507's GWP sits at 3,985, making it just as problematic as R404A under current environmental regulations.
The most promising comparison is R404A versus R448A. This newer blend offers a massive 68% reduction in GWP - dropping from 3,922 down to just 1,274. Even better, R448A maintains similar performance to R404A while using the same POE oil. From our retrofit experience across Tennessee, Texas, and beyond, R448A provides the smoothest transition path we've found.
The pressure-temperature relationship between R404A and R448A is close enough that most existing controls and safety devices don't need changes. We've successfully converted dozens of mortuary cooling systems without major component replacements, which keeps costs manageable for funeral home operators.
More info about regulatory changes covers the timeline and requirements that are driving these refrigerant transitions. The bottom line is that facilities using R404A need to start planning their transition strategy now, before supply becomes scarce and prices skyrocket even further.

Frequently Asked Questions about the r404a pt chart
Working with the r404a pt chart raises some common questions, especially when you're troubleshooting systems in the field. After years of installing and servicing mortuary coolers across the country, we've heard these same questions countless times from technicians and facility managers.
Let me walk you through the most important ones that come up during our service calls.
What pressure should I expect at -10°F evaporator temperature?
When your evaporator is running at -10°F, you should see approximately 20.8 psig on your low-side manifold gauge. This is actually a sweet spot for many mortuary freezer applications where we need to maintain consistent sub-zero temperatures.
But here's the thing - if your gauge is showing something way different, your system is trying to tell you something. Pressures significantly below 20.8 psig usually point to an undercharged system or restricted airflow across the evaporator. We see this a lot when funeral homes haven't been changing their air filters regularly.
Pressures running high at this temperature often indicate an overcharged system or non-condensables that snuck into the refrigerant circuit. Sometimes it's as simple as air that got in during a repair, but it can really mess with your system's performance.
The beauty of knowing this reference point is that you can quickly assess system health without diving into complex diagnostics. If you're way off 20.8 psig at -10°F, that's where you start your troubleshooting.
Which point—bubble or dew—do I use for superheat?
This question trips up a lot of technicians, but once you understand the logic, it's actually pretty straightforward. Always use the dew point pressure when calculating superheat - no exceptions.
Think about what superheat actually measures. You're looking at how much hotter your refrigerant vapor is compared to when it would start condensing back into liquid. That condensation point is exactly what the dew point represents on your r404a pt chart.
The bubble point, on the other hand, is for subcooling calculations because you're dealing with liquid refrigerant and need to know when it would start boiling.
With R404A's 0.7°F temperature glide, using the wrong reference point might seem like a small mistake, but it can throw off your precision work. In mortuary applications where temperature control is absolutely critical, that small error can make the difference between proper system operation and problems down the road.
I've seen technicians get confused because some refrigerants are pure and don't have this bubble/dew point distinction. But with R404A being a blend, you've got to pay attention to which column you're reading on the chart.
How does elevation affect my gauge readings?
Elevation is one of those factors that catches people off guard, especially when we're installing systems in places like Denver or Salt Lake City. For every 1,000 feet above sea level, you need to add approximately 0.5 psi to your gauge readings when you're consulting the r404a pt chart.
Here's why this happens: your manifold gauges read pressure relative to atmospheric pressure, and atmospheric pressure drops as you go higher. At sea level, atmospheric pressure is 14.7 psi, but at 5,000 feet elevation, it's only around 12.2 psi.
Quick reference for elevation corrections: At 1,000 feet, add 0.5 psi to your readings. At 3,000 feet, add 1.5 psi. At 5,000 feet (like Denver), add 2.5 psi. At 7,000 feet, you're looking at adding 3.5 psi.
We learned this lesson the hard way on a job in a mountain resort town where we couldn't figure out why our pressures seemed off. Once we factored in the elevation correction, everything made perfect sense.
The important thing to remember is that this only affects your gauge readings. Relief valve settings and other absolute pressure specifications don't change with elevation - they're designed to work at the actual pressure regardless of where you are.
Conclusion & Next Steps
Mastering the r404a pt chart isn't just about memorizing numbers—it's about understanding the language your refrigeration system speaks. After years of installing and servicing mortuary coolers across the country, I can tell you that technicians who truly understand pressure-temperature relationships are the ones who solve problems quickly and keep systems running reliably.
At American Mortuary Coolers, we've seen how critical temperature control is in funeral homes. When a family is grieving, the last thing they should worry about is whether their loved one is being properly cared for. That's why we insist every technician in our network knows how to read the r404a pt chart like a roadmap to system health.
The fundamentals we've covered—using dew point pressures for superheat calculations, bubble point for subcooling, and adjusting for elevation—form the foundation of competent refrigeration work. Those key reference points of 0°F = 32.6 psig, 40°F = 85.4 psig, and 100°F = 234.6 psig should become second nature.
But let's be honest about the elephant in the room: R404A's high GWP of 3,922 means its days are numbered. The EPA's phase-down schedule is real, and prices are already climbing. Smart facility managers are planning their transitions now, not waiting until they're forced to make emergency decisions.
That doesn't mean you should panic if you're running R404A systems today. These systems can operate safely and efficiently for years with proper maintenance. The r404a pt chart remains your best diagnostic tool for keeping them running smoothly while you plan for the future.
For mortuary facilities specifically, we recommend developing a replacement timeline that considers both regulatory deadlines and equipment age. A 15-year-old R404A system might be worth replacing proactively with a lower-GWP alternative, while a 5-year-old system could justify continued operation with proper maintenance.
Your next steps should include staying current with refrigeration best practices, planning for regulatory changes, and ensuring your service technicians understand both current and emerging refrigerant technologies. The r404a pt chart will serve you well today, but tomorrow's technicians will need to master new refrigerants and their unique characteristics.
More info about R404A pressure charts provides additional resources for expanding your knowledge and staying ahead of industry changes.
Whether you're troubleshooting a system today or planning for tomorrow's regulations, understanding pressure-temperature relationships is a skill that transfers across all refrigerants. Master the r404a pt chart, and you'll be better prepared for whatever refrigerant comes next.


