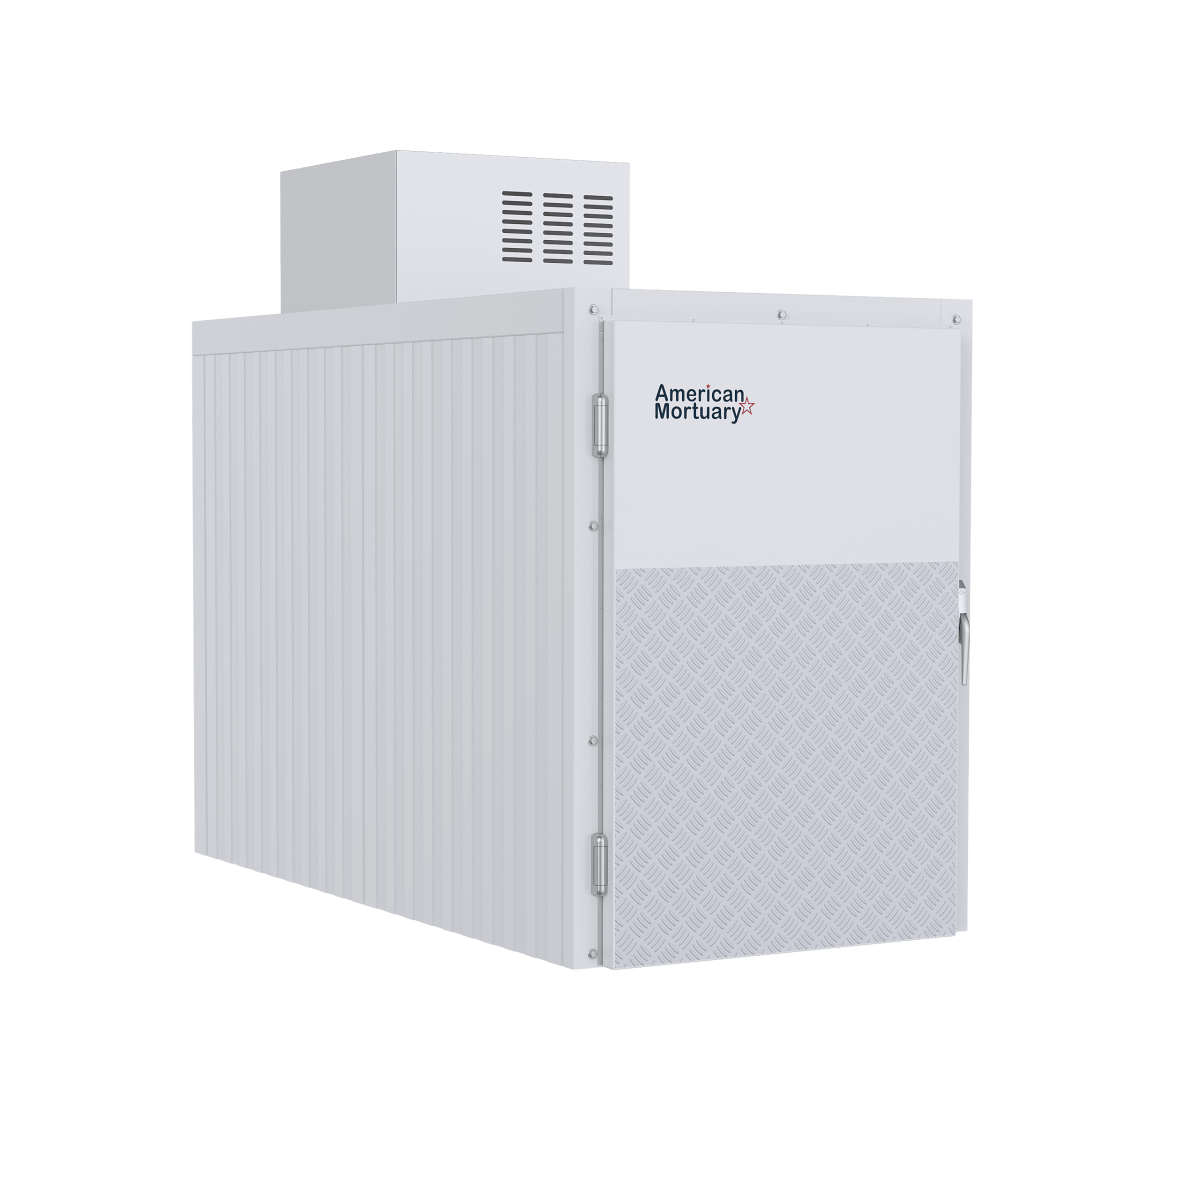
Why Understanding PT Charts is Essential for R404A Refrigeration Systems
A pt chart r404a is a pressure-temperature reference table that shows the saturation pressures of R404A refrigerant at specific temperatures. Here's what you need to know:
Key R404A Pressure Values:
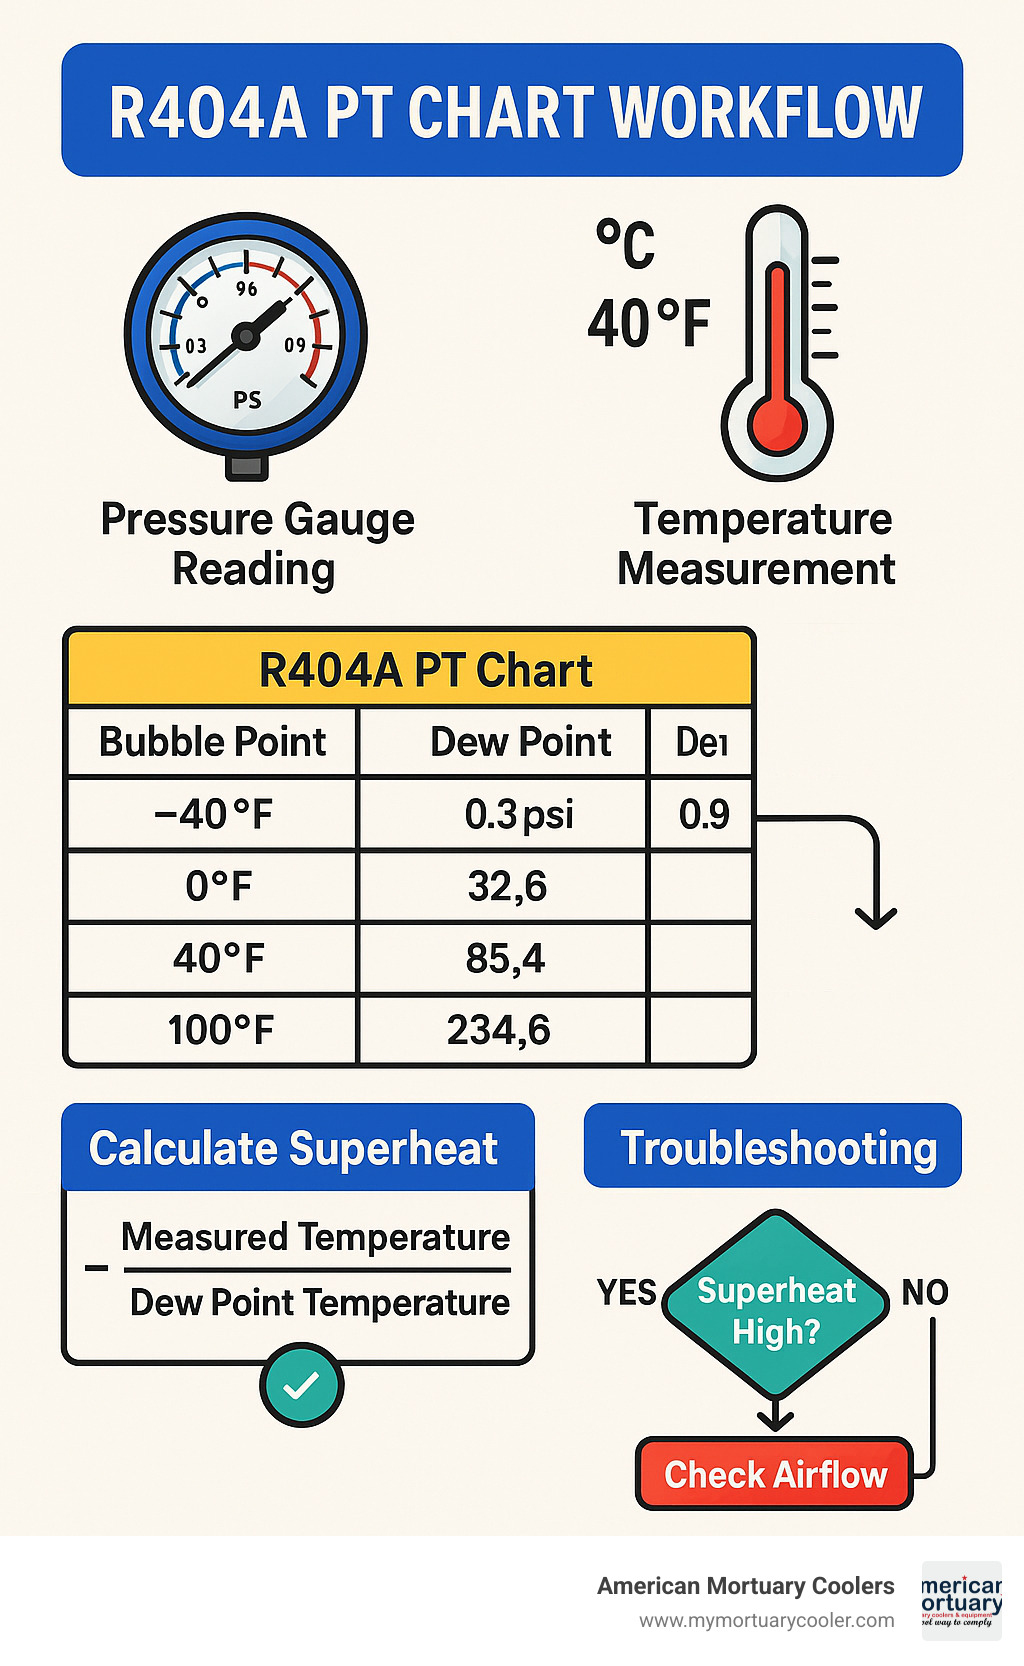
- At -40°F: 0.3 psig (vapor) / 0.9 psig (liquid)
- At 0°F: 32.6 psig
- At 40°F: 85.4 psig
- At 100°F: 234.6 psig
Essential Uses:
- Calculate superheat and subcooling
- Diagnose system problems
- Set proper operating pressures
- Verify refrigerant charge levels
R404A is a zeotropic blend refrigerant commonly used in low-temperature commercial refrigeration applications, including mortuary coolers and walk-in freezers. Unlike single-component refrigerants, R404A has a small temperature glide of 1–2°F, meaning it changes temperature slightly during phase transitions.
Understanding how to read and use a PT chart is critical for anyone maintaining refrigeration equipment. For funeral home directors managing mortuary cooling equipment, accurate PT chart data ensures your refrigeration systems operate efficiently and maintain the precise temperatures required for your facilities.
I'm American Mortuary Coolers, a national-level mortuary cooler supplier with extensive experience helping funeral homes maintain their refrigeration systems. My background includes working with various refrigerants including R404A, and I've seen how understanding pt chart r404a data can prevent costly equipment failures and ensure reliable operation.
Pt chart r404a helpful reading:
What Is a PT Chart and Why It's Critical for R404A
A pt chart r404a is your refrigeration system's roadmap - a pressure-temperature reference table that tells you exactly what pressure R404A refrigerant should be at any given temperature when it's saturated (right at the point of changing between liquid and vapor).
Your refrigeration system works by having refrigerant absorb heat when it evaporates at low pressure, then reject heat when it condenses at high pressure. Without knowing the correct saturation pressure for each temperature, you're essentially flying blind.
R404A is a zeotropic blend - a mixture of three different refrigerants: R-125 (44%), R-143a (52%), and R-134a (4%). This blend gives R404A excellent performance characteristics, but it also means it behaves differently than single-component refrigerants.
The key difference is that R404A has two important pressure points at each temperature:
Bubble point is where the first vapor bubbles start forming when you heat saturated liquid refrigerant. Dew point is where the first liquid droplets appear when you cool saturated vapor. The small gap between these points creates temperature glide - about 1-2°F for R404A.
The pressure-temperature relationships come from the NIST REFPROP database, which provides laboratory-accurate information. This precision is especially important for low-temperature refrigeration applications where even small pressure variations can throw off your entire system.
You can find comprehensive PT charts at the PT Chart Selection resource, which covers R404A and many other refrigerants.
Typical Applications of R404A Refrigerant
R404A has become the go-to refrigerant for many commercial cooling applications due to its stable pressure-temperature relationship and excellent low-temperature performance.
Walk-in coolers and freezers represent the largest use of R404A, particularly effective in systems maintaining temperatures between -10°F and 40°F. Commercial freezers in supermarkets and food service operations rely heavily on R404A for frozen food display cases and ice cream freezers.
The transport refrigeration industry uses R404A for refrigerated trucks and shipping containers. For our industry specifically, morgue freezers and mortuary cooling systems often use R404A, requiring absolute reliability and precise temperature control.
Cascade systems sometimes use R404A as the high-stage refrigerant when ultra-low temperatures (below -40°F) are needed.
For a deeper dive into how these systems work, check out our guide on Refrigeration System 101: Understanding the Basics.
How to Read and Use a PT Chart R404A
Learning to read a pt chart r404a is like reading a map — once you know what the symbols mean, you can steer anywhere. You'll need calibrated pressure gauges that can handle pressures from vacuum up to at least 300 psig for high-side pressures.
Most PT charts show pressures in psig (pounds per square inch gauge), which reads zero at normal atmospheric pressure. Standard PT charts are calibrated for sea-level atmospheric pressure (14.7 psia). At higher elevations like 5,000 feet, atmospheric pressure drops to about 12.2 psia, affecting your gauge readings.
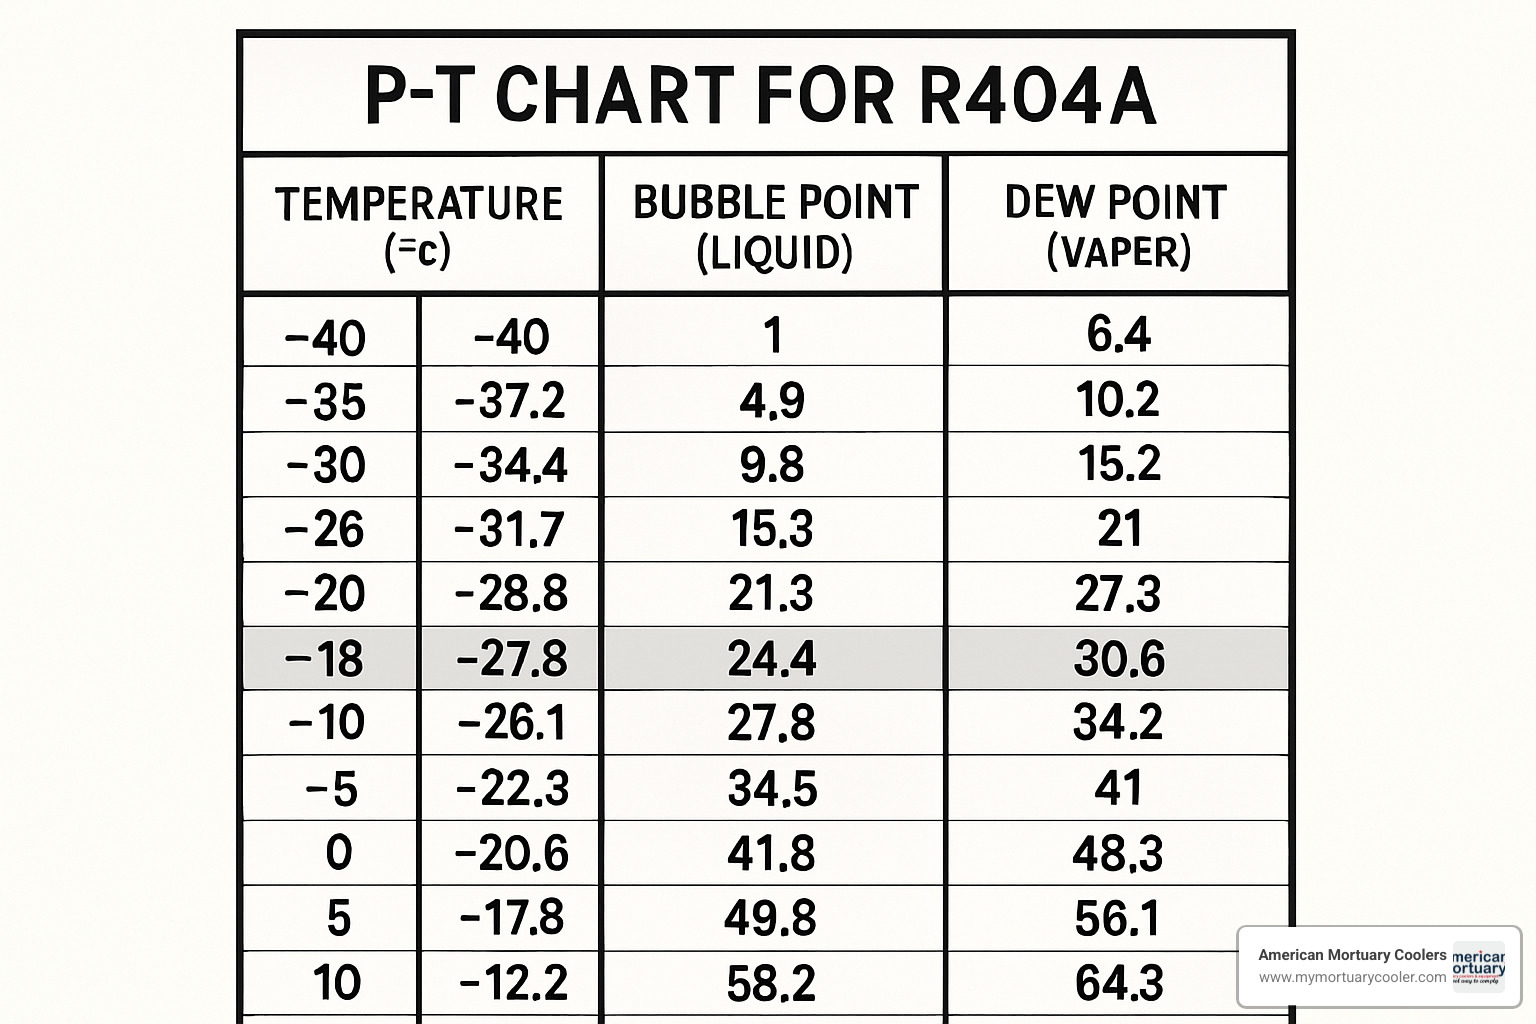
Because R404A is a zeotropic blend, you'll often see dual-column charts with separate readings for bubble point (liquid) and dew point (vapor) pressures.
For unit conversions: 1 psig equals 6.895 kPa or 0.06895 bar. For temperature conversions, use (°F − 32) × 5/9 to get Celsius, or (°C × 9/5) + 32 to get Fahrenheit.
Understanding Bubble Point & Dew Point
The bubble point is the temperature and pressure where the first vapor bubbles appear when you heat a saturated liquid. The dew point is where the first liquid droplets form when cooling a saturated vapor.
R404A's fractionation means the three components don't all change phase at exactly the same temperature, creating a temperature glide of 1–2°F.
When taking measurements: use the bubble point column for liquid line measurements and use the dew point column for vapor line measurements.
Using the pt chart r404a to Calculate Superheat
Superheat calculations prevent liquid refrigerant from damaging your compressor. Superheat is the temperature of vapor above its saturation temperature at a given pressure.
For superheat calculations, always use the dew point (vapor) column. Measure the actual temperature of the suction line where it enters the compressor using a digital thermometer.
The superheat formula: Superheat = Actual Suction Temperature − Saturation Temperature (from dew point column).
Example: If your suction pressure reads 33 psig and suction line temperature is 15°F, look up 33 psig in the dew point column (approximately 0°F). Your superheat is 15°F − 0°F = 15°F.
Most systems should operate with 10–20°F of superheat at the evaporator outlet and 20–30°F at the compressor suction.
Using the pt chart r404a for Subcooling
Subcooling ensures only liquid refrigerant enters your expansion valve. Subcooling is the temperature of liquid below its saturation temperature at a given pressure.
For subcooling calculations, use the bubble point (liquid) column. Measure the temperature of the liquid line leaving the condenser.
The subcooling formula: Subcooling = Saturation Temperature (from bubble point column) − Actual Liquid Temperature.
Example: If your liquid line pressure is 235 psig and temperature is 90°F, look up 235 psig in the bubble point column (approximately 100°F). Your subcooling is 100°F − 90°F = 10°F.
Most systems should operate with 8–15°F of subcooling for optimal performance.
For more guidance, check out our article on Beginner Freezer Temperature Mistakes and How to Avoid Them.
Altitude & Unit Conversion Tips
At 5,000 feet elevation, atmospheric pressure drops about 2.5 psi below sea level, affecting your gauge readings. Some manufacturers provide altitude-corrected PT charts for precision work.
Pressure conversions: To convert kPa to psig, divide by 6.895 then subtract 14.7. For bar to psig, multiply by 14.504 then subtract 14.7.
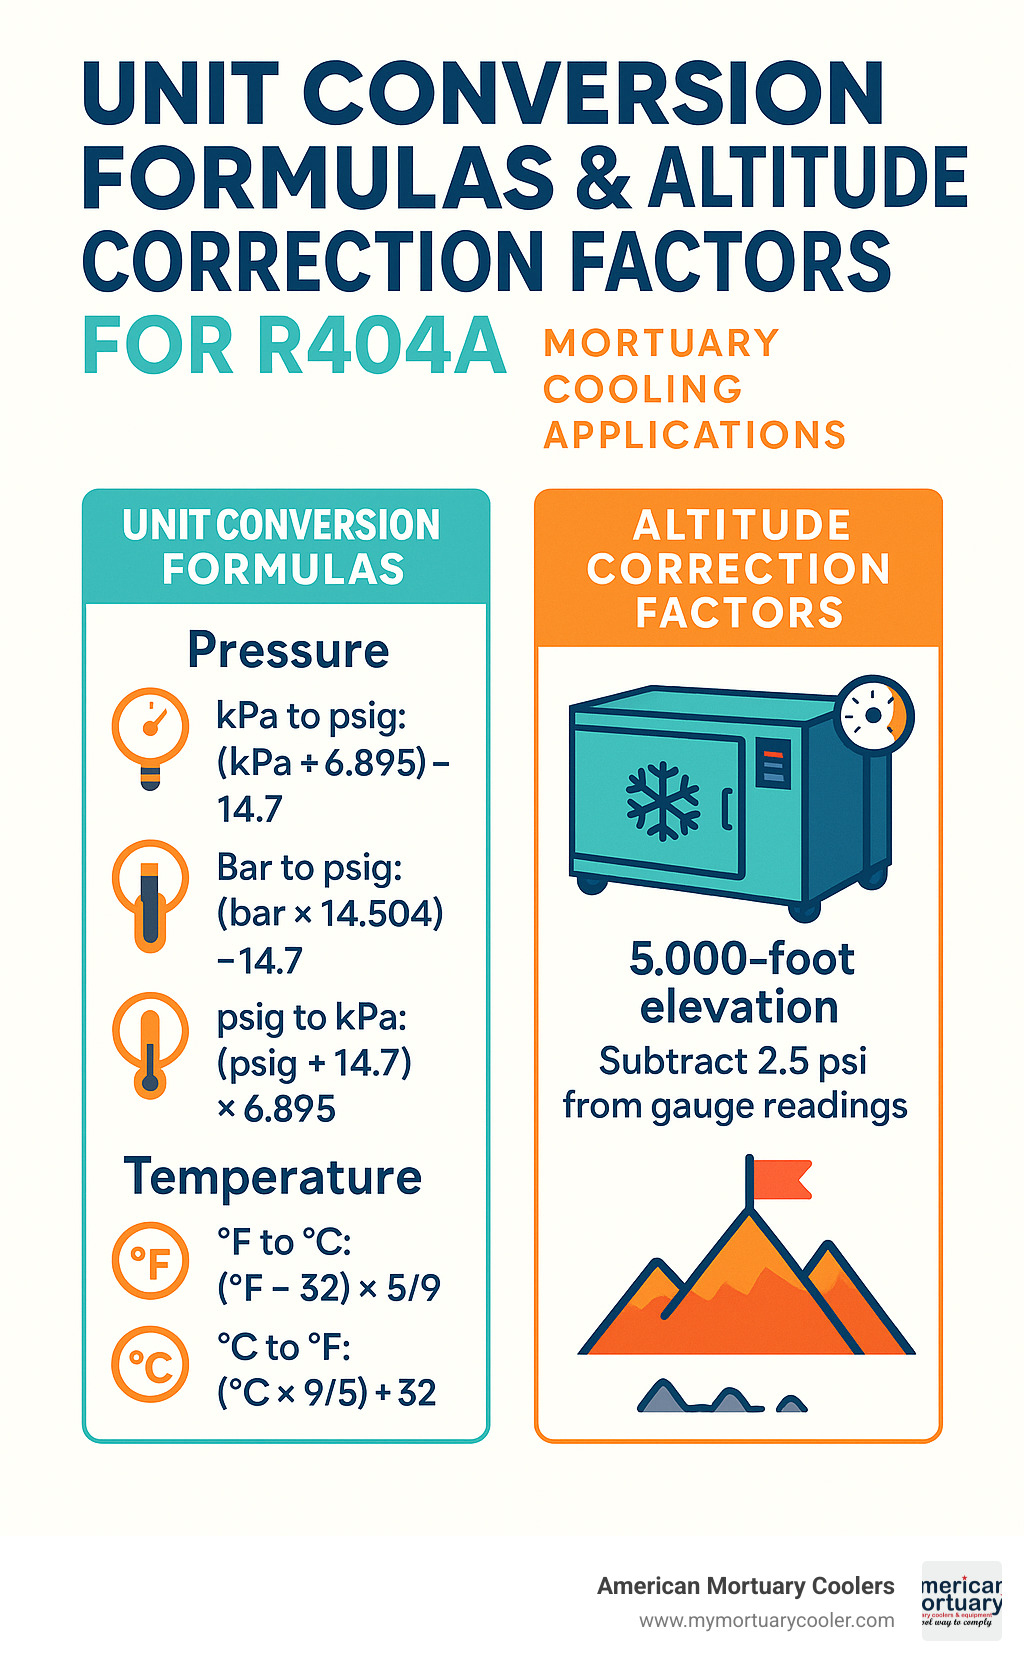
Keep a conversion chart handy until these calculations become automatic.
Pressure Benchmarks for R404A at Common Temperatures
When you're working with R404A refrigeration systems, knowing the pressure benchmarks at common temperatures can save you time and help you quickly identify problems. These pt chart r404a values are based on precise NIST REFPROP data, so you can rely on them for accurate diagnostics.
Let's start with the ultra-low temperatures you'll encounter in mortuary applications. At -40°F, R404A operates in challenging conditions with pressures just above vacuum. The vapor pressure sits at 0.3 psig, while the liquid pressure reaches 0.9 psig. This small gap between liquid and vapor pressures shows why R404A works well in low-temperature applications — there's less confusion about what phase you're dealing with.
Moving up to more common freezer temperatures, at 0°F you'll see the saturation pressure around 32.6 psig. This is a critical reference point that many technicians memorize because it's so commonly encountered in walk-in freezers and mortuary coolers.
For medium-temperature applications like walk-in coolers, at 40°F the saturation pressure jumps to approximately 85.4 psig. This is where many cooler evaporators operate, making it another important benchmark to remember.
On the high side of your system, at 100°F — a typical condensing temperature — you'll see pressures around 234.6 psig. This pressure level is crucial for proper condenser operation and heat rejection.
There's also an important limit to be aware of. R404A reaches its critical point at 161.7°F and 540.8 psi. Beyond this point, the refrigerant can't distinguish between liquid and vapor phases, which means your system won't work properly if it gets this hot.
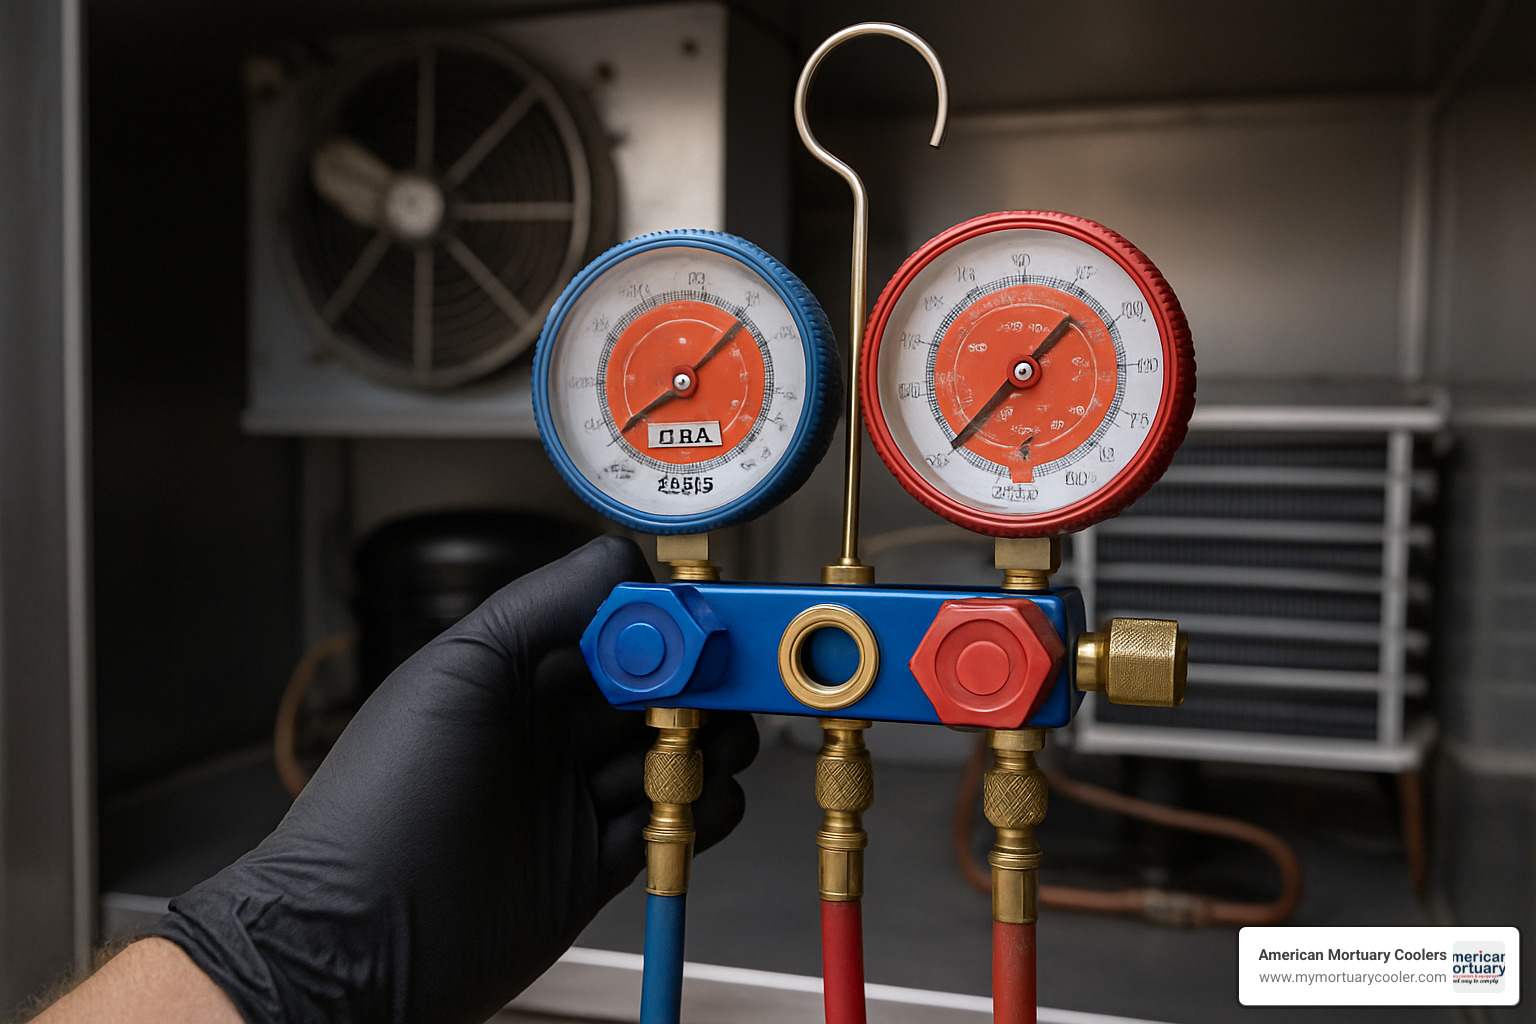
One thing that makes R404A relatively easy to work with is the small liquid-vapor pressure gap. Unlike some high-glide blends that can have significant pressure differences between phases, R404A typically shows only 1–2 psi difference. This makes field measurements more straightforward and reduces confusion during diagnostics.
Quick Reference Bubble vs Dew Pressures
Having a quick reference for bubble and dew point pressures can make your job much easier when you're standing in front of a system that's not behaving properly. Here's a snapshot of the key pressures you'll encounter:
| Temperature (°F) | Bubble Point (psig) | Dew Point (psig) |
|---|---|---|
| -40 | 0.9 | 0.3 |
| -20 | 16.0 | 15.2 |
| 0 | 34.7 | 33.6 |
| 20 | 58.9 | 57.5 |
| 40 | 89.7 | 88.0 |
| 60 | 128.6 | 126.5 |
| 80 | 176.8 | 174.3 |
| 100 | 236.8 | 234.6 |
Many color-coded PT charts use red italics to highlight the vacuum region, which for R404A occurs below approximately -51°F. When you're working in these conditions, extra care is needed to prevent air from being drawn into the system.
If you need pressures for temperatures between these listed values, you can interpolate linearly with reasonable accuracy for most practical applications. For example, if you need the pressure at 10°F, you can estimate it falls halfway between the 0°F and 20°F values.
The vacuum region deserves special attention in mortuary cooling applications. When systems operate at very low temperatures, they may pull vacuum on the low side. This isn't necessarily a problem, but it does require careful attention to system integrity to prevent air infiltration that could damage the compressor or reduce efficiency.
Safety, Environmental Impact, and Alternatives
R404A has an A1 safety classification from ASHRAE, meaning it's non-flammable and has low toxicity. Always wear safety glasses, insulated gloves, and long sleeves when working with refrigerant, and ensure proper ventilation.
R404A requires polyolester (POE) oil for proper lubrication. POE oil is hygroscopic, absorbing moisture from the air, so be extra careful with evacuation procedures and keep oil containers sealed.
The bigger challenge is environmental impact. R404A has a Global Warming Potential (GWP) of 3,922, making it a significant contributor to climate change. One pound of R404A has the same warming effect as nearly 4,000 pounds of carbon dioxide.
The EPA has implemented phase-down schedules under the AIM Act. HFC refrigerants like R404A face significant restrictions, with allowances dropping to just 15% of baseline levels by 2036.
Several lower-GWP alternatives are available. R452A has a GWP of 2,141 - a 45% reduction from R404A. R448A and R449A both have GWPs around 1,280, representing about a 67% reduction. These alternatives can often be used as drop-in or near-drop-in replacements.
For funeral homes planning ahead, our guide on The 2025 Freon Transition: What Funeral Homes Need to Know provides detailed information about upcoming changes.
Retrofit considerations include checking pressure-temperature differences, oil compatibility requirements, and ensuring your system components can handle the alternative refrigerant.
You can find specific PT chart information for R452A at R-452A XP44 Refrigerant PT Chart - Refrigerant HQ to help with your comparison.
Using pt chart r404a Data to Vet Replacement Options
Your pt chart r404a becomes a valuable tool when evaluating replacement refrigerants as your baseline for comparison.
Pressure matching is crucial when considering alternatives. Compare the operating pressures of potential replacements to R404A at the same temperatures. Compressor limits are another critical factor - ensure alternative refrigerants won't exceed maximum pressure and temperature ratings.
Temperature glide comparison is important since R404A has a small temperature glide of just 1-2°F. Larger glides can affect system performance and diagnostic procedures.
Performance characteristics should be evaluated using PT chart data for your specific operating conditions at both evaporating and condensing temperatures.
Troubleshooting Refrigeration Systems with the PT Chart
When your mortuary cooler starts acting up, a pt chart r404a becomes your detective tool - it helps you compare what should be happening with what's actually happening in your system.
High superheat (above 25°F) usually points to an undercharged system, restricted expansion valve, or dirty evaporator coil. Low suction pressure indicates system undercharge, expansion valve restrictions, evaporator airflow problems, or compressor efficiency issues.
Overcharge symptoms show up as high suction pressure, dangerously low superheat (risking liquid slugging), high head pressure, and poor system efficiency.
Non-condensables like air or moisture cause abnormally high head pressure and temperature-pressure relationships that don't match your PT chart. Oil logging affects heat transfer efficiency and disrupts normal pressure-temperature relationships.
For funeral home operators, check out our guide on Cold Comfort: Understanding Walk-In Cold Rooms for more insights.
Step-by-Step Diagnostic Checklist
Start with a visual inspection - look for obvious leaks, damage, or loose connections. Verify proper airflow and secure electrical connections.
Get your gauge readings by connecting manifold gauges to service ports. Let the system stabilize for 10-15 minutes before taking readings. Record both high and low side pressures.
Temperature measurements are equally important. Measure suction line temperature at the compressor inlet and liquid line temperature at the condenser outlet. Record ambient and box temperatures.
PT chart verification brings everything together. Compare measured pressures to expected values from your pt chart r404a. Calculate superheat using dew point data and subcooling using bubble point data.
Take corrective actions based on your findings. Address readings outside normal ranges, adjust refrigerant charge if necessary, clean or repair components as indicated, and always retest after making corrections.
Frequently Asked Questions about R404A PT Charts
What are the pressure values of R404A at –40 °F, 0 °F, 40 °F, and 100 °F?
These four temperature points cover the full range you'll encounter in most refrigeration applications:
At -40°F, R404A shows vapor pressure of 0.3 psig and liquid pressure of 0.9 psig - ultra-low temperature conditions for specialty applications.
At 0°F, R404A runs at approximately 32.6 psig - a key reference point for walk-in freezers and mortuary coolers.
At 40°F, you're looking at approximately 85.4 psig - common for walk-in cooler evaporators and prep room coolers.
At 100°F, the pressure jumps to approximately 234.6 psig - typical condensing temperatures on warmer days.
The difference between liquid and vapor pressures stays small - just 1-2 psi across the range, making R404A more forgiving to work with than high-glide refrigerants.
How do I choose the correct column on a two-column PT chart?
Use the bubble point (liquid) column when working with the liquid side of your system - calculating subcooling, measuring liquid line conditions, or dealing with saturated liquid refrigerant.
Use the dew point (vapor) column for the vapor side - calculating superheat, measuring suction line conditions, or working with saturated vapor refrigerant.
Practical tip: measurements near the compressor suction use the dew point column; measurements near the condenser outlet or liquid line use the bubble point column.
Where can I download a reliable PT chart for R404A?
For accuracy, look for charts based on the NIST REFPROP database - the gold standard for thermodynamic data.
HVAC Buddy offers interactive PT charts useful for field work. Most refrigerant manufacturers provide downloadable PDF charts on their websites. Mobile apps have become handy for field use, providing PT chart data even without internet service.
Whatever source you choose, verify it's current and from a reputable provider. With R404A facing phase-down restrictions, accurate data becomes even more important as we transition to alternative refrigerants.
Conclusion
Mastering the pt chart r404a isn't just about memorizing pressure values—it's about understanding how your refrigeration system operates. Whether diagnosing a mortuary cooler that isn't maintaining proper temperatures or troubleshooting a walk-in freezer cycling issues, these charts provide the roadmap to find answers.
At American Mortuary Coolers, we've worked with funeral homes nationwide, from Tennessee to facilities across the country. Technicians who understand pressure-temperature relationships can quickly identify problems that leave others frustrated with trial-and-error troubleshooting.
PT data accuracy becomes critical as we steer the changing refrigerant landscape. With R404A's high global warming potential driving regulatory restrictions, many facilities are planning transitions to alternative refrigerants. Understanding pt chart r404a data gives you the foundation to evaluate alternatives and ensure continued reliable operation.
Equipment longevity depends on proper refrigerant management. When you can accurately calculate superheat and subcooling, spot overcharge conditions early, and identify efficiency problems, you're protecting investments that cost thousands to replace. For funeral homes where equipment failure isn't just inconvenient—it's potentially devastating—this knowledge provides invaluable peace of mind.
The principles you learn with R404A PT charts translate to other refrigerants. Whether working with R452A, R448A, or future alternatives, the fundamental process of using pressure-temperature relationships for system diagnosis remains the same.
For funeral directors managing facilities, understanding these basics helps you communicate effectively with service technicians and make informed maintenance decisions. You don't need expertise, but knowing when pressure readings don't match expected values helps catch problems early and avoid emergency service calls.
The investment in learning PT chart fundamentals pays dividends in energy efficiency, reduced service calls, and reliable equipment operation. In an industry where precision and dependability matter, these tools help ensure your cooling systems meet the exacting standards your profession demands.
For more insights on optimizing refrigeration systems and reducing operating costs, explore our comprehensive guide on The Ultimate Guide to Energy Efficient Coolers.


